. 2009 Feb;44(2):357-63.
doi: 10.1016/j.bone.2008.10.042. Epub 2008 Oct 29.

Diabetes causes the accelerated loss of cartilage during fracture repair which is reversed by insulin treatment

Affiliations

Diabetes causes the accelerated loss of cartilage during fracture repair which is reversed by insulin treatment

Rayyan A Kayal et al. Bone. 2009 Feb.

Abstract

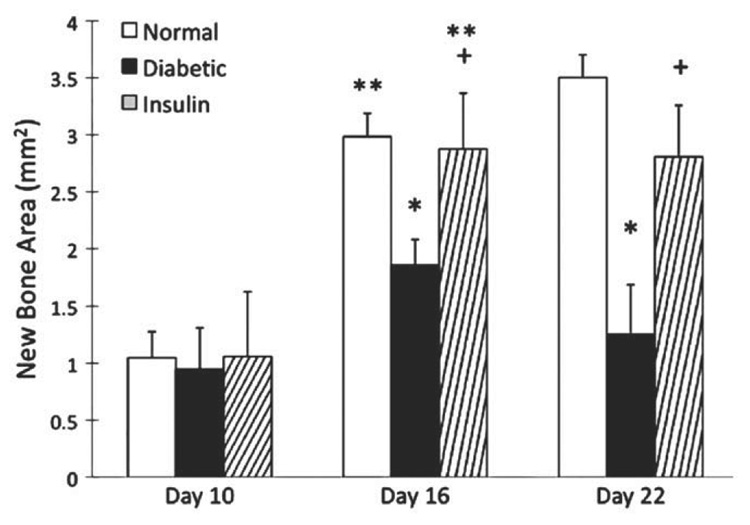
Fracture healing in diabetic individuals and in animal models of diabetes is impaired. To investigate mechanisms by which diabetes may affect fracture healing we focused on the transition from cartilage to bone, a midpoint in the fracture healing process. Femoral fractures were induced in mice rendered diabetic by multiple low dose streptozotocin treatment and compared to matching normoglycemic mice. One group of diabetic animals was treated with slow release insulin to maintain normal serum glucose levels. The results indicate that there was relatively little difference in the initial formation of the fracture callus on day 10. However, on day 16 the diabetic group had significantly smaller callus, greater loss of cartilage and enhanced osteoclastogenesis that was normalized by treatment with insulin when assessed by histomorphometric analysis. Chondrocyte apoptosis was significantly higher in diabetic mice and this increase was blocked by insulin. These changes were accompanied by diabetes-increased mRNA levels of RANKL, TNF-alpha, and ADAMTS-4 and -5 measured by real-time PCR, which was reversed by insulin treatment. On days 16 and 22 bone formation within the callus of diabetic mice was significantly less than the normoglycemic and brought to normal levels by insulin treatment. These results suggest that a significant effect of diabetes on fracture healing is increased chondrocyte apoptosis and osteoclastogenesis that accelerates the loss of cartilage and reduces the anlage for endochondral bone formation during fracture repair. That insulin reverses these effects demonstrates that they are directly related to the diabetic condition.


Figures

Fig. 1
Fig. 1
(A) Comparison of callus size in diabetic, normoglycemic and diabetic insulin treated mice with femoral fracture. Callus area was measured in H&E stained cross-sections obtained from 3 points sampled at the fracture line and 0.5mmproximal and distal and presented as the sum of these three sites. (B) Comparison of cartilage area in diabetic, normoglycemic and diabetic insulin treated mice with femoral fracture. The area of cartilage within each callus was measured in safranin-O/fast green stained sections in the same manner. The individual measurements were averaged to establish a value of total callus area per animal for each of the 3 time points examined. Data are expressed as mean±SEM. * indicates a significant difference between normal and diabetic (P<0.05). + indicates significant difference between insulin treated and untreated diabetic animals (P<0.05). ** indicates a significant difference compared with the previous time point within a group (P<0.05). (C)mRNA levels of markers of cartilage formation. mRNA levels were measured by real-time PCR for Collagen 2 and collagen 10. Each marker was evaluated in 3 separate experiments using 3 mice in each set (total n=3) and the results are expressed as mean±SEM.
Fig. 2
Fig. 2
Comparison of cartilage area at 0.5 mm intervals in diabetic, normoglycemic and diabetic insulin treated mice with femoral fracture. Cartilage area was measured at 5 points sampled at the fracture line and 0.5 mm and 1.0 mm proximal and distal at the indicated time point. Data are expressed as mean±SEM. * indicates a significant difference between normal and diabetic (P<0.05). + indicates a significant difference between insulin treated and untreated diabetic animals (P<0.05).
Fig. 3
Fig. 3
Comparison of osteoclast numbers in diabetic, normoglycemic and diabetic insulin treated mice. (A) The number of osteoclasts was measured in TRAP stained sections and normalized to cartilage and new bone area. For a given animal three points along a 1 mm length of the callus were sampled, the individual counts were averaged to establish a value of total osteoclast number per animal for each of the 3 time points. (B) Detailed comparison of osteoclast numbers at 0.5 mm intervals in diabetic, normoglycemic and diabetic insulin treated mice with femoral fracture on day 16. Data are expressed as mean±SEM. * indicates a significant difference between normal and diabetic (P<0.05). + indicates a significant difference between insulin treated and untreated diabetic animals (P<0.05). ** indicates a significant difference compared with the previous time point within a group (P<0.05).
Fig. 4
Fig. 4
mRNA levels of cytokines that regulate osteoclastogenesis in femoral fracture. mRNA levels were measured by real-time PCR for TNF-α, RANKL, RANK and OPG. Each cytokine was evaluated in 3 separate experiments using 3 mice in each set (total n=3) and the results are expressed as mean ± SEM. * indicates a significant difference between normal and diabetic (P<0.05). + indicates a significant difference between insulin treated and untreated diabetic animals (P<0.05). ** indicates a significant difference compared with the previous time point within a group (P<0.05).
Fig. 5
Fig. 5
mRNA levels of enzymes associated with cartilage degradation during fracture repair. mRNA levels were measured by real-time PCR for ADAMTS-4 and ADAMTS-5. Each enzyme was evaluated in 3 separate experiments using 3 mice each (n=3) and the results are expressed as mean ± SEM. *indicates a significant difference between normal and diabetic (P<0.05). + indicates a significant difference between insulin treated and untreated diabetic animals (P<0.05). ** indicates a significant difference compared with the previous time point within a group (P<0.05).
Fig. 6
Fig. 6
Comparison of apoptotic cell numbers in diabetic, normoglycemic and diabetic insulin treated mice with femoral fracture. The number of apoptotic cells within each callus was measured in TUNEL stained sections combined with safranin-O/fast green stain to distinguish chondrocytes on day 16 specimens. For a given animal a section from the midline of the callus was chosen for the assay. (A) Apoptotic chondrocytes were counted and normalized to cartilage area. (B) The total number of apoptotic cells was normalized to callus area. Data are expressed as mean ± SEM. * indicates a significant difference between normal and diabetic (P<0.05). + indicates a significant difference between insulin treated an untreated diabetic animals (P<0.05).
Fig. 7
Fig. 7
Comparison of new bone area in diabetic, normoglycemic and diabetic insulin treated mice with femoral fracture. The area of new bone within each callus was measured in Masson's trichrome stained sections in the same manner as described in Fig. 1. Data are expressed as mean ± SEM. * indicates a significant difference between normal and diabetic (P<0.05). + indicates a significant difference between insulin treated and untreated diabetic animals (P<0.05). ** indicates a significant difference compared with the previous time point within a group (P<0.05).

References

    1. Gerstenfeld LC, Wronski TJ, Hollinger JO, Einhorn TA. Application of histomorphometric methods to the study of bone repair. J Bone Miner Res. 2005;20:1715–1722. - PubMed
    1. Jehle PM, Jehle DR, Mohan S, Bohm BO. Serum levels of insulin-like growth factor system components and relationship to bone metabolism in Type 1 and Type 2 diabetes mellitus patients. J Endocrinol. 1998;159:297–306. - PubMed
    1. Tuominen JT, Impivaara O, Puukka P, Ronnemaa T. Bone mineral density in patients with type 1 and type 2 diabetes. Diabetes Care. 1999;22:1196–1200. - PubMed
    1. Ivers RQ, Cumming RG, Mitchell P, Peduto AJ. Diabetes and risk of fracture: The Blue Mountains Eye Study. Diabetes Care. 2001;24:1198–1203. - PubMed
    1. Nicodemus KK, Folsom AR. Type 1 and type 2 diabetes and incident hip fractures in postmenopausal women. Diabetes Care. 2001;24:1192–1197. - PubMed

Publication types

MeSH terms