

Genome-wide association analysis of susceptibility and clinical phenotype in multiple sclerosis
- PMID: 19010793
- PMCID: PMC4334814
- DOI: 10.1093/hmg/ddn388
Genome-wide association analysis of susceptibility and clinical phenotype in multiple sclerosis
Abstract
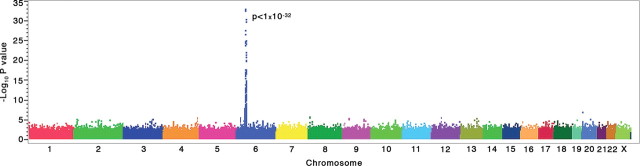
Multiple sclerosis (MS), a chronic disorder of the central nervous system and common cause of neurological disability in young adults, is characterized by moderate but complex risk heritability. Here we report the results of a genome-wide association study performed in a 1000 prospective case series of well-characterized individuals with MS and group-matched controls using the Sentrix HumanHap550 BeadChip platform from Illumina. After stringent quality control data filtering, we compared allele frequencies for 551 642 SNPs in 978 cases and 883 controls and assessed genotypic influences on susceptibility, age of onset, disease severity, as well as brain lesion load and normalized brain volume from magnetic resonance imaging exams. A multi-analytical strategy identified 242 susceptibility SNPs exceeding established thresholds of significance, including 65 within the MHC locus in chromosome 6p21.3. Independent replication confirms a role for GPC5, a heparan sulfate proteoglycan, in disease risk. Gene ontology-based analysis shows a functional dichotomy between genes involved in the susceptibility pathway and those affecting the clinical phenotype.
Figures


References
-
- Hauser S.L., Goodin D.S. Multiple sclerosis and other demyelinating diseases. In: Fauci A.D., Kasper D.L., Braunwald E., Hauser S.L., Longo D.L., Jameson J.L., editors. Harrison's Principle of Internal Medicine. 17th edn. NY: McGraw Hill; 2008.
-
- Compston A., Coles A. Multiple sclerosis. Lancet. 2002;359:1221–1231. - PubMed
-
- Pugliatti M., Sotgiu S., Rosati G. The worldwide prevalence of multiple sclerosis. Clin. Neurol. Neurosurg. 2002;104:182–191. - PubMed
-
- Hauser S.L., Oksenberg J.R. The neurobiology of multiple sclerosis: genes, inflammation, and neurodegeneration. Neuron. 2006;52:61–76. - PubMed
-
- Olerup O., Hillert J. HLA class II-associated genetic susceptibility in multiple sclerosis: a critical evaluation. Tissue Antigens. 1991;38:1–15. - PubMed
Publication types
MeSH terms
Substances
Grants and funding
LinkOut - more resources
Full Text Sources
Other Literature Sources
Medical
Molecular Biology Databases
Research Materials
