. 2009 May;50(5):2328-36.
doi: 10.1167/iovs.08-2936. Epub 2008 Nov 14.

Thickness of receptor and post-receptor retinal layers in patients with retinitis pigmentosa measured with frequency-domain optical coherence tomography

Affiliations

Thickness of receptor and post-receptor retinal layers in patients with retinitis pigmentosa measured with frequency-domain optical coherence tomography

Donald C Hood et al. Invest Ophthalmol Vis Sci. 2009 May.

Abstract

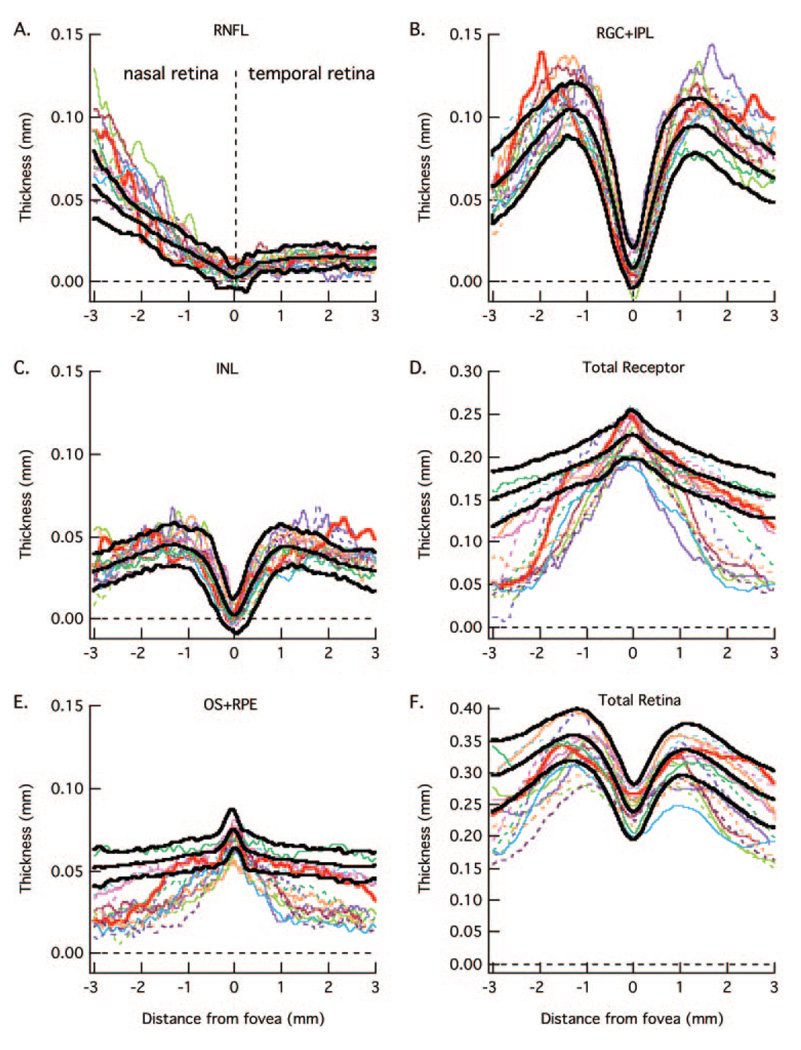
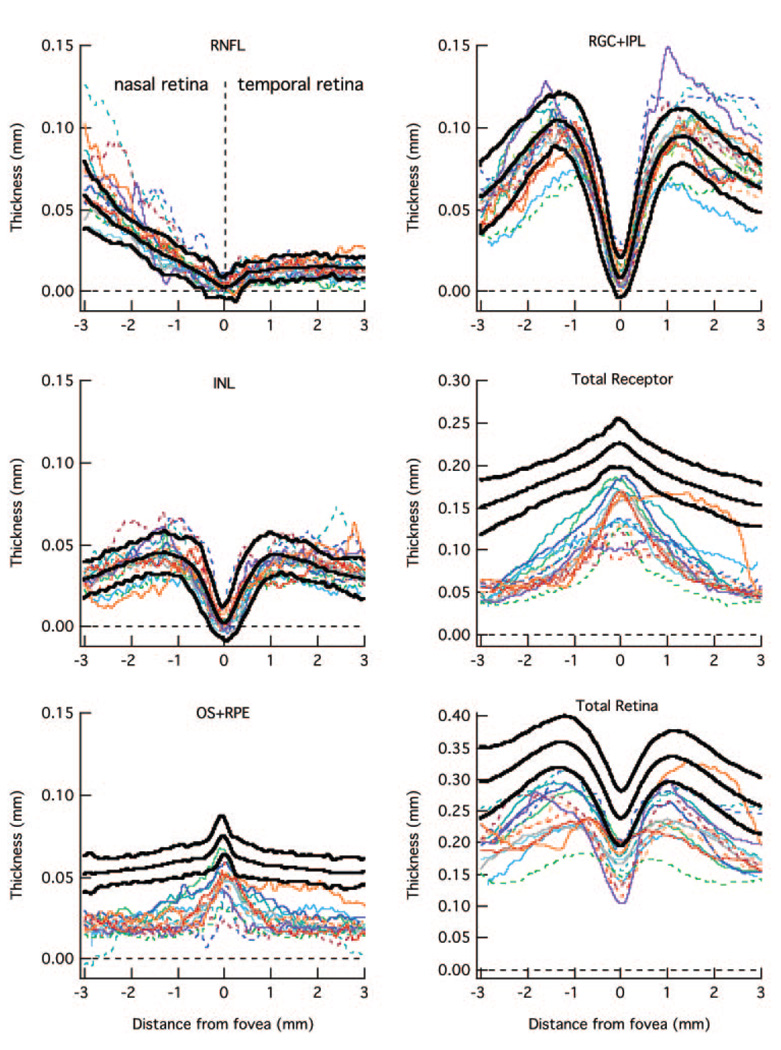
Purpose: To better understand the effects of retinitis pigmentosa (RP) on post-receptor anatomy, the thicknesses of the receptor, inner nuclear, retinal ganglion cell (RGC), and retinal nerve fiber layers (RNFL) were measured with frequency-domain optical coherence tomography (fdOCT).

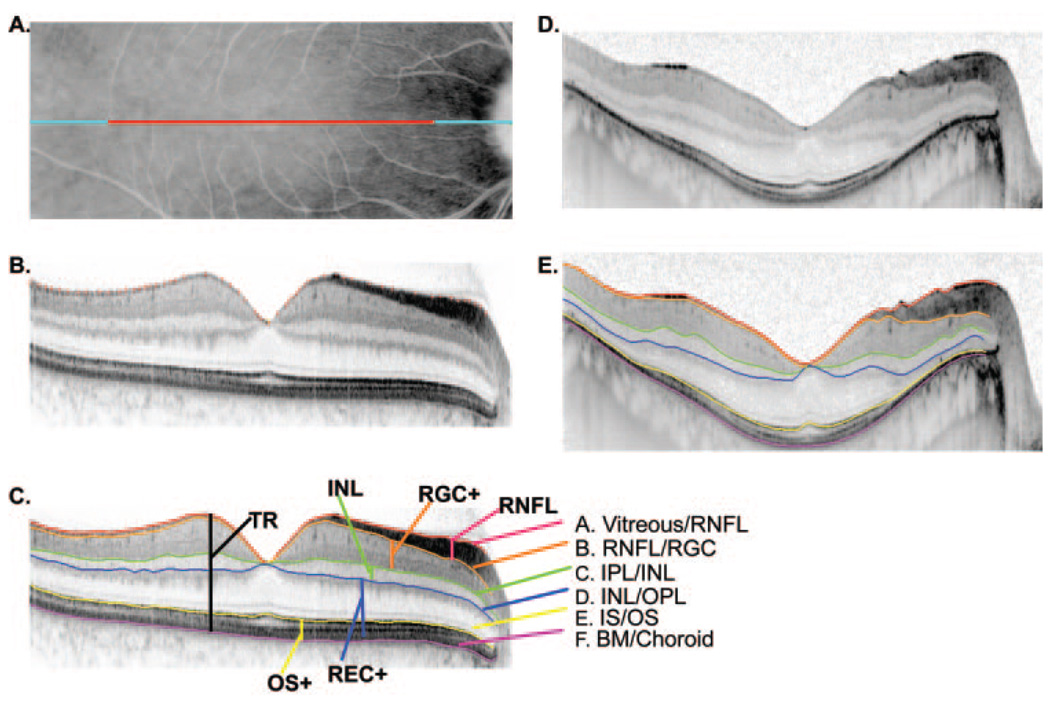
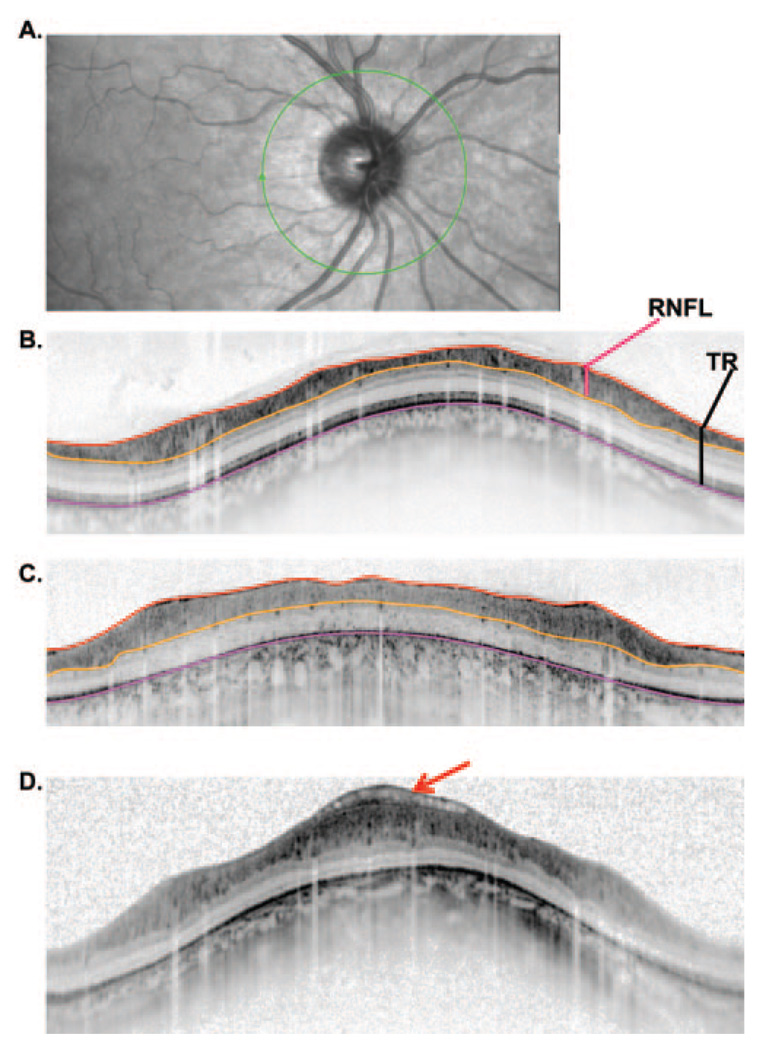
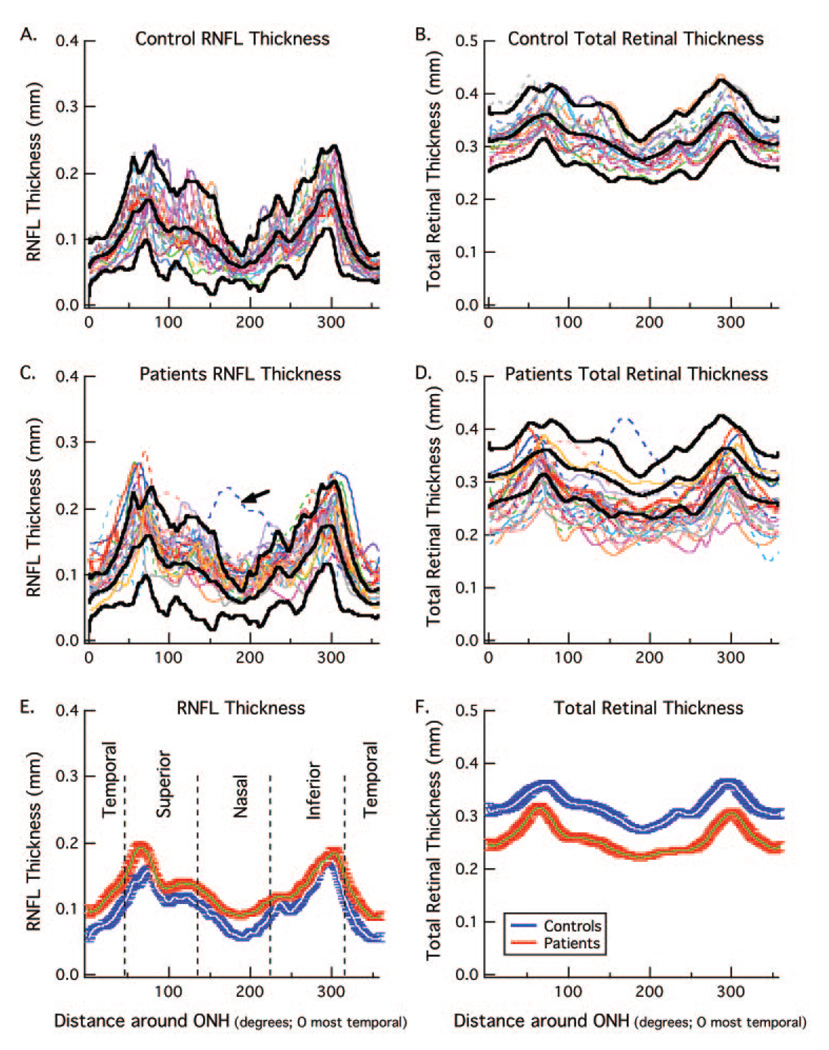
Methods: FdOCT scans were obtained from the horizontal midline in 30 patients with RP and 23 control subjects of comparable age. Raw images were exported and the thicknesses of photoreceptor/RPE, inner nuclear, RGC plus inner plexiform, and nerve fiber layers were measured with a manual segmentation procedure aided by a computer program. The RNFL thickness was also measured in 20 controls and 25 patients using circular peripapillary fdOCT scans.

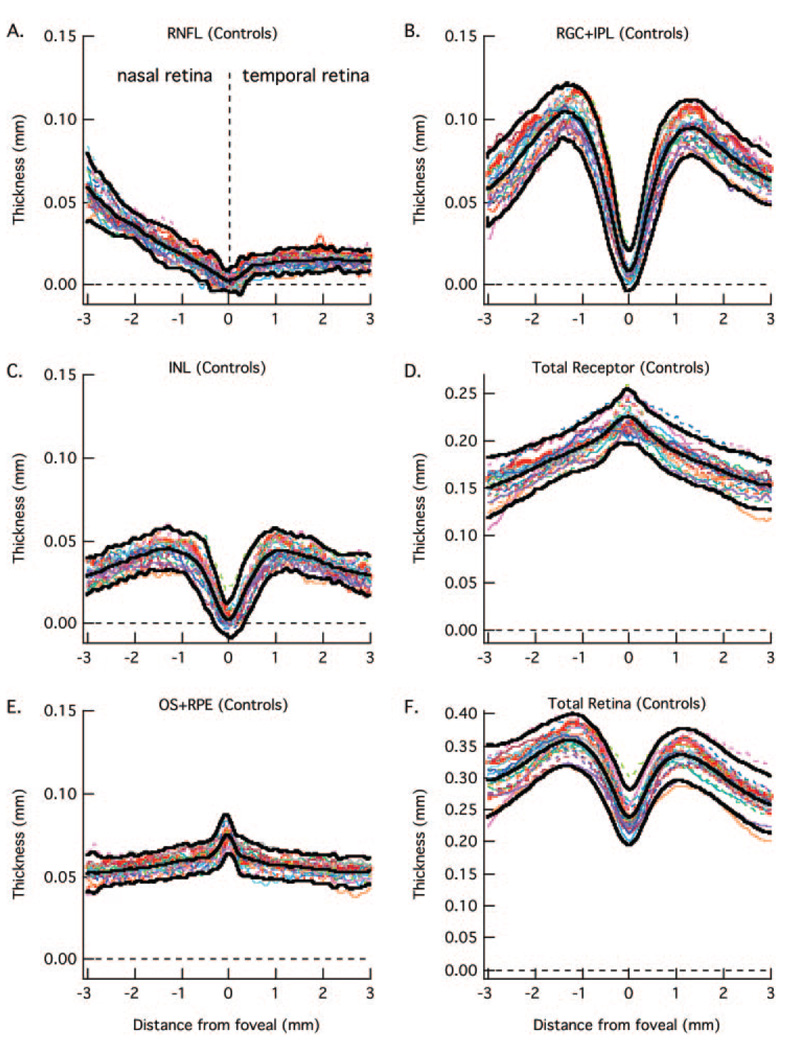
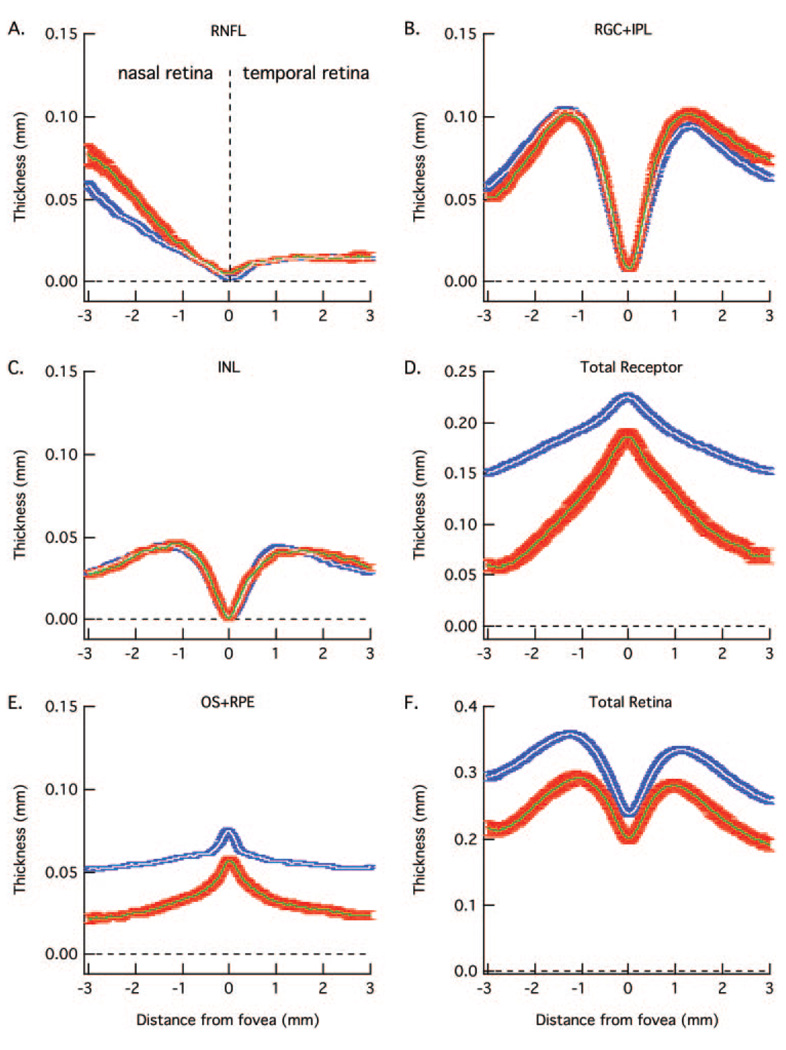
Results: Results from controls were consistent with known anatomy. In patients with RP, the pattern of photoreceptor loss with eccentricity was consistent with the field constriction characteristic of RP. INL and RGC layer measures were comparable to normal subjects, although some patients showed slightly thicker RGC layers. However, RNFL layer thickness was significantly greater than normal; a majority of patients showed a thicker RFNL on both horizontal midline scans and peripapillary scans.

Conclusions: To make optimal use of OCT RNFL thickness as a measure of the integrity of RGCs in patients with RP, a better understanding of the causes of the thickening seen in the majority of the patients is needed. As the RGC layer thickness can be measured with fdOCT, RGC layer thickness may turn out to be a more direct and valid indicator of the presence of RGCs in patients with RP.


Figures

FIGURE 1
FIGURE 1
(A) Fundus view showing the extent of the 9 mm (blue) and 6 mm (red) single scan lines. (B) A line scan for a normal control showing the markers placed for the vitreous/RNFL border. (C) The same scan as in (B) with the boundaries drawn by the program based on markings such as in (B). (D) Same as in (B), but for a patient with RP. (E) Same as in (C) but for a patient with RP.
FIGURE 2
FIGURE 2
(A) Fundus view of an optic disc with the location of the peripapillary circular scan (green). (B) A peripapillary scan of a normal control with the lines marking the borders of the vitreous/RNFL (red), RNFL/RGC (orange), and BM/choroid (pink) (see Fig. 1C). The total retinal (TR) thickness (black vertical line) and RNFL thickness (red vertical line) were calculated from these borders as indicated. (C) Same as in (B) for a patient with RP. (D) A patient’s scan showing an abnormality that gets included in the RNFL thickness measure for this patient.
FIGURE 3
FIGURE 3
The RNFL (A), RGC+ (B), INL (C), total receptor + (D), OS+ (E), and total retina (F) thickness curves are shown for 23 normal controls (colored lines). The bold lines are the mean ± 2 SD.
FIGURE 4
FIGURE 4
The white and blue curves are the mean ± 1 SE for the 23 normal controls in Figure 3 and the green and red curves are the mean ± 1 SE for the 30 patients in Figure 5 and Figure 6. As in Figure 3, RNFL (A), RGC+ (B), INL (C), total receptor + (D), OS+ (E), and total retina (F) thickness curves are shown in separate panels.
FIGURE 5
FIGURE 5
The RNFL (A), RGC+ (B), INL (C), total receptor + (D), OS+ (E), and total retina (F) thickness curves are for 15 patients (colored lines) with the smallest loss in receptor thickness (D) in the center fovea. The bold lines are the mean ± 2 SD for the controls from Figure 3.
FIGURE 6
FIGURE 6
The RNFL (A), RGC+ (B), INL (C), total receptor + (D), OS+ (E), and total retina (F) thickness curves are for 15 patients (colored lines) with the largest loss in receptor thickness (D) in the center fovea. The bold lines are the mean ± 2 SD for the controls from Figure 3.
FIGURE 7
FIGURE 7
(A) RNFL thickness for 20 normal controls (colored curves) with the mean and ± 2 SD of these curves shown as the bold black curves. (B) Total retinal thickness for the same 20 normal controls (colored curves) with the mean and ± 2 SD of these curves shown as the bold black curves. (C) RNFL thickness for 25 patients (colored curves) with the mean and ± 2 SD for the controls from (A) shown as the bold black curves. (D) Total retinal thickness for the same 25 patients (colored curves) with the mean and ± 2 SD for the controls from (B) shown as the bold black curves. (E) The white and blue curves are the mean RNFL thickness ± one SE for the 20 normal controls in panel (A) and the green and red curves are the mean RNFL thickness ± one SE for 24 of the 25 patients in (C), the outlier indicated with the arrow in (C) was omitted. (F) The white and blue curves are the mean total retinal thickness ± one SE for the 20 normal controls in (B) and the green and red curves are the mean total retinal thickness ± one SE for 24 of the patients in (D).

Similar articles

Cited by

References

    1. Rizzo JF, III, Wyatt J, Loewenstein J, Kelly S, Shire D. Methods and perceptual thresholds for short-term electrical stimulation of human retina with microelectrode arrays. Invest Ophthalmol Vis Sci. 2003;44:5355–5361. - PubMed
    1. Jensen RJ, Rizzo JF., III Activation of retinal ganglion cells in wild-type and rd1 mice through electrical stimulation of the retinal neural network. Vision Res. 2008;48:1562–1568. - PubMed
    1. Tao W, Wen R, Goddard MB, et al. Encapsulated cell-based delivery of CNTF reduces photoreceptor degeneration in animal models of retinitis pigmentosa. Invest Ophthalmol Vis Sci. 2002;43:3292–3298. - PubMed
    1. Sieving PA, Caruso RC, Tao W, et al. Ciliary neurotrophic factor (CNTF) for human retinal degeneration: phase I trial of CNTF delivered by encapsulated cell intraocular implants. Proc Natl Acad Sci U S A. 2006;103:3896–3901. - PMC - PubMed
    1. Stone JL, Barlow WE, Humayun MS, de Juan E, Jr, Milam AH. Morphometric analysis of macular photoreceptors and ganglion cells in retinas with retinitis pigmentosa. Arch Ophthalmol. 1992;110:1634–1639. - PubMed

Publication types