. 2009 Jan;191(2):486-93.
doi: 10.1128/JB.01294-08. Epub 2008 Nov 14.

Dynamic association of the replication initiator and transcription factor DnaA with the Bacillus subtilis chromosome during replication stress

Affiliations

Dynamic association of the replication initiator and transcription factor DnaA with the Bacillus subtilis chromosome during replication stress

Adam M Breier et al. J Bacteriol. 2009 Jan.

Abstract

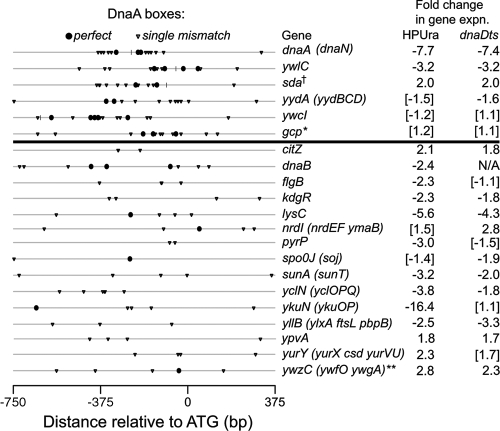
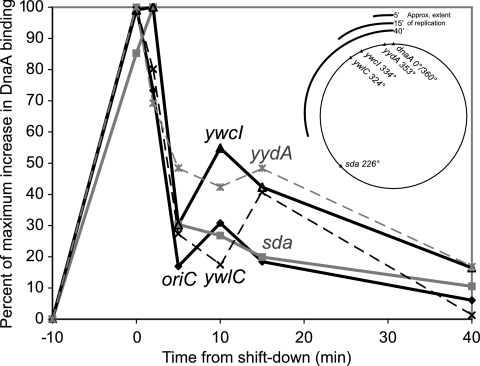
DnaA functions as both a transcription factor and the replication initiator in bacteria. We characterized the DNA binding dynamics of DnaA on a genomic level. Based on cross-linking and chromatin immunoprecipitation data, DnaA binds at least 17 loci, 15 of which are regulated transcriptionally in response to inhibition of replication (replication stress). Six loci, each of which has a cluster of at least nine potential DnaA binding sites, had significant increases in binding by DnaA when replication was inhibited, indicating that the association of DnaA with at least some of its target sites is altered after replication stress. When replication resumed from oriC after inhibition of replication initiation, these high levels of binding decreased rapidly at origin-proximal and origin-distal regions, well before a replication fork could pass through each of the regulated regions. These findings indicate that there is rapid signaling to decrease activation of DnaA during replication and that interaction between DnaA bound at each site and the replication machinery is not required for regulation of DnaA activity in response to replication stress.


Figures

FIG. 1.
FIG. 1.
Genome-wide DnaA ChIP-chip profiles for arrested, replicating, and dnaA null cells. The enrichment of each chromosomal region in the DnaA ChIP sample relative to total DNA is plotted versus the chromosomal position relative to oriC at 0°, in the center of the graphs. For each data set, at least three biological replicates were collected, and the median for each locus on the arrays is shown. (A) Wild-type cells (AG174) in exponential growth phase were treated with HPUra for 60 min at 32°C, cross-linked, and harvested for ChIP-chip assay. (B) dnaD(Ts) (KPL73) cells in exponential growth phase at 32°C were shifted to the restrictive temperature (47°C) for 90 min, cross-linked, and harvested for ChIP-chip assay. (C) dnaB(Ts) (KPL69) cells in exponential growth phase at 32°C were shifted to the restrictive temperature (47°C) for 90 min, cross-linked, and harvested for ChIP-chip assay. (D) Wild-type cells (AG174) in exponential growth phase at 32°C were cross-linked and harvested for ChIP-chip assay. (E) dnaA null mutant cells (AIG200) in exponential growth phase at 32°C were cross-linked and harvested for ChIP-chip assay. The signal at 283° (−77° in the figure) is that for yutF; there appears to be a protein bound here that interacts nonspecifically with the anti-DnaA antibody (see text for more details).
FIG. 2.
FIG. 2.
DnaA binding at loci with clustered DnaA boxes. Data are shown for specific regions from Fig. 1, plotted for ∼8-kb regions centered around clustered DnaA boxes, where DnaA binding increased substantially upon inhibition of replication. Chromosomal positions are listed as distances (in kilobases) from oriC, and enrichment is shown as described in the legend to Fig. 1. DnaA box locations are indicated by diamonds below the data traces; filled and open diamonds represent perfect and single-mismatch boxes, respectively. Gene locations and orientations are indicated with arrows. Expression of genes with asterisks is altered after inhibition of replication (15). Expression of all genes indicated with asterisks decreases after replication inhibition, except for that of sda, which increases. Data are shown in the vicinities of dnaA (A), ywlC (B), ywcI (C), yydA (D), gcp (E), and sda (F). Filled squares with solid lines represent wild-type cells (AG174) 60 min after treatment with HPUra, filled circles with dotted lines represent untreated wild-type cells (AG174), gray open circles and lines represent dnaA null mutant cells (AIG200), and filled triangles with solid lines represent dnaD(Ts) cells (KPL73) after 90 min at 47°C.
FIG. 3.
FIG. 3.
Distribution of DnaA boxes at sites bound by DnaA. Shown are locations of perfect (solid circles) and single-mismatch (triangles) DnaA boxes occurring from 750 bp upstream to 375 bp downstream of the start codons of genes where DnaA binding was detected in either ChIP-chip or ChIP-PCR experiments. The first six regions indicated (above the thick line) all have at least nine potential DnaA binding sites with ≤1 mismatch from the consensus and have increased enrichment after inhibition of replication (Table 1; Fig. 1 and 2). Regions indicated below the thick line are those with fewer than nine potential DnaA binding sites. Enrichment at these regions did not consistently increase when replication was inhibited, and DnaA enrichment at flgB, nrdI, sunA, and yllB was greater than that at the background locus yabM but was not statistically significant (Table 2). Listed at right are the transcriptional changes in each of these genes due to inhibition of elongation with HPUra and inhibition of initiation by high-temperature incubation of dnaD(Ts) cells. Listed in parentheses are genes in the same operon that also responded transcriptionally. The data are from reference . Bracketed values are not statistically significant. Functions of the genes potentially regulated by DnaA have been summarized previously (15, 20), and they include genes involved in DNA replication (dnaA, dnaN, dnaB, and perhaps ypvA), cell division (ftsL and pbpB), nucleotide metabolism (nrdI, nrdE, and nrdF), pyrimidine biosynthesis (pyrP), lantibiotic biosynthesis (sunA and sunT), sporulation (sda and spo0J), and several unknown functions (“y” genes). †, sda and the yqeGH-aroD-yqeIJK operon are divergently transcribed, and both respond to inhibition of replication (the yqeG operon decreases ∼2 to 3-fold); *, the region shown for gcp is downstream of its 3′ end; **, gene expression values are listed for ywfO (ywzC did not respond to replication inhibition).
FIG. 4.
FIG. 4.
Release of DnaA binding after resumption of replication. dnaD(Ts) cells (KPL73) in exponential growth phase were shifted to the restrictive temperature for 60 min and then shifted back to the permissive temperature in order to generate a synchronous round of replication initiation. Samples were taken for ChIP-PCR analysis immediately before and at the end of the incubation at the restrictive temperature and 2, 5, 10, 15, and 40 min after the shift back to the permissive temperature. DnaA binding was analyzed at oriC/dnaA (solid diamonds and black lines), yydA (gray asterisks and gray dashed lines), ywcI (solid triangles and black lines), ywlC (black X characters and black dashed lines), and sda (filled gray squares and solid gray lines). Data were normalized according to the basal and maximal levels of signal detected to facilitate comparison of binding kinetics at sites with different levels of DnaA binding (see, for example, levels at dnaA/oriC and sda in Fig. 2). Data are shown in the vicinities of mntH (A), yloB (B), pksN (C), nrdE (D), sunA (E), yrhC (F), ywpH (G), spo0J (H), and ysmB (I). The map in the upper right shows the position of each analyzed site on the chromosome and the approximate extent of replication 5, 15, and 40 min after release.

References

    1. Atlung, T., E. S. Clausen, and F. G. Hansen. 1985. Autoregulation of the dnaA gene of Escherichia coli K12. Mol. Gen. Genet. 200442-450. - PubMed
    1. Berkmen, M. B., and A. D. Grossman. 2007. Subcellular positioning of the origin region of the Bacillus subtilis chromosome is independent of sequences within oriC, the site of replication initiation, and the replication initiator DnaA. Mol. Microbiol. 63150-165. - PubMed
    1. Braun, R. E., K. O'Day, and A. Wright. 1985. Autoregulation of the DNA replication gene dnaA in E. coli K-12. Cell 40159-169. - PubMed
    1. Breier, A. M., and A. D. Grossman. 2007. Whole-genome analysis of the chromosome partitioning and sporulation protein Spo0J (ParB) reveals spreading and origin-distal sites on the Bacillus subtilis chromosome. Mol. Microbiol. 64703-718. - PubMed
    1. Britton, R. A., P. Eichenberger, J. E. Gonzalez-Pastor, P. Fawcett, R. Monson, R. Losick, and A. D. Grossman. 2002. Genome-wide analysis of the stationary-phase sigma factor (sigma-H) regulon of Bacillus subtilis. J. Bacteriol. 1844881-4890. - PMC - PubMed

Publication types

MeSH terms

LinkOut - more resources