. 2008 Nov 25;105(47):18408-12.
doi: 10.1073/pnas.0805566105. Epub 2008 Nov 14.

Light, nutrients, and food-chain length constrain planktonic energy transfer efficiency across multiple trophic levels

Affiliations

Light, nutrients, and food-chain length constrain planktonic energy transfer efficiency across multiple trophic levels

Elizabeth M Dickman et al. Proc Natl Acad Sci U S A. .

Abstract

The efficiency of energy transfer through food chains [food chain efficiency (FCE)] is an important ecosystem function. It has been hypothesized that FCE across multiple trophic levels is constrained by the efficiency at which herbivores use plant energy, which depends on plant nutritional quality. Furthermore, the number of trophic levels may also constrain FCE, because herbivores are less efficient in using plant production when they are constrained by carnivores. These hypotheses have not been tested experimentally in food chains with 3 or more trophic levels. In a field experiment manipulating light, nutrients, and food-chain length, we show that FCE is constrained by algal food quality and food-chain length. FCE across 3 trophic levels (phytoplankton to carnivorous fish) was highest under low light and high nutrients, where algal quality was best as indicated by taxonomic composition and nutrient stoichiometry. In 3-level systems, FCE was constrained by the efficiency at which both herbivores and carnivores converted food into production; a strong nutrient effect on carnivore efficiency suggests a carryover effect of algal quality across 3 trophic levels. Energy transfer efficiency from algae to herbivores was also higher in 2-level systems (without carnivores) than in 3-level systems. Our results support the hypothesis that FCE is strongly constrained by light, nutrients, and food-chain length and suggest that carryover effects across multiple trophic levels are important. Because many environmental perturbations affect light, nutrients, and food-chain length, and many ecological services are mediated by FCE, it will be important to apply these findings to various ecosystem types.


Conflict of interest statement

The authors declare no conflict of interest.

Figures
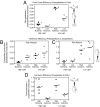
Fig. 1.
Fig. 1.
Light, nutrient, and fish effects on FCE (2-way ANOVA, n = 12, P = 0.0009) (A), herbivore efficiency (3-way ANOVA, n = 23, P = 0.0003) (B and C), and carnivore efficiency (2-way ANOVA, n = 12, P = 0.0138) (D). Each point represents the efficiency for an individual mesocosm, obtained by using production rates averaged over the experiment for each trophic level. Horizontal lines represent treatment means, and letters indicate treatments that are significantly different from each other (Tukey post hoc test). For herbivore efficiency, all 8 treatments (fish absent and fish present) were analyzed together, although they are graphically depicted separately. Note that the scale differs in fish present vs. fish absent treatments for herbivore efficiency. In 2 mesocosms, carnivore efficiency exceeded 1, possibly because toward the end of the experiment fish consumed some benthic algae, although zooplankton still made up the majority of their diet (see SI Text for more details). Note that herbivore efficiency was >1 in some low light mesocosms, possibly because of some consumption by zooplankton of foods other than phytoplankton, such as other zooplankton (intraguild predation), periphyton, and bacteria. The relative contributions of the production of bacteria and periphyton, relative to PPr, were higher in the low-light treatments (unpublished data). Diagrams represent efficiencies depicted in the graphs. Note the difference in scale between fish absent and fish present treatments.
Fig. 2.
Fig. 2.
Quality of phytoplankton as a food resource based on cell stoichiometry (A–D) and taxonomic composition (E and F). Phytoplankton responses were measured in each mesocosm throughout the study, and each point represents a mesocosm mean, averaged over the experiment. Horizontal lines represent treatment means, and letters indicate treatments that are significantly different from each other (Tukey post hoc test). Treatments with fish present and absent were analyzed separately.
Fig. 3.
Fig. 3.
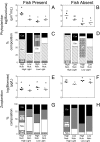
Biomass and community composition responses of phytoplankton and zooplankton. (A, B, E, and F) Phytoplankton (A and B) and zooplankton (E and F) biomass. Each point represents the mean for a mesocosm, averaged over the experiment. Horizontal lines represent treatment means, and letters indicate treatments that are significantly different from each other (Tukey post hoc test). (C and D) Relative biovolume of major phytoplankton taxonomic groups for each treatment, averaged across the experiment. Cya, cyanobacteria; Cryp, cryptomonads; Dia, diatoms; Grn, green algae; Fla, small flagellates; Oth, phytoplankton groups that made up <10% of total phytoplankton biovolume when averaged across the study within a treatment. (G and H) The relative biomass of major zooplankton taxonomic groups for each treatment was averaged across the experiment. Cla, cladocerans; Adult cop, adult copepods; Nau, nauplii; Rot, rotifers.
Fig. 4.
Fig. 4.
Relationships between PPr and phytoplankton food quality and fish responses. Each point represents the value for an individual mesocosm. Except in A and B, values are those averaged over the experiment. (A) Proportion of fish surviving to the end of the experiment. (B) Mean fish dry mass at the end of the experiment. (C) Fish production. (D) Phytoplankton C/P stoichiometric food quality. (E) Phytoplankton compositional food quality. Phytoplankton compositional and stoichiometric food quality data are shown only for treatments with fish present. Best fit lines, r2, and P values are given for each relationship, using either linear or polynomial regression, whichever gave the best fit. High light treatments are represented by squares, and low light treatments are indicated by circles. High nutrient treatments are depicted with closed symbols, and low nutrient treatments are depicted with open symbols.
Fig. 5.
Fig. 5.
Body C (P < 0.0001), N (P = 0.0485), and P (P = 0.0034) (A–C) and C:N (P < 0.0001), C:P (P = 0.0007), and N:P (P = 0.0038) (D–F) of larval gizzard shad, regressed against fish wet mass at the end of the experiment (ANCOVA, n = 31 for all variables). Significant (P < 0.05) ANCOVA results are indicated.

References

    1. Hairston NG, Hairston NG. Cause–effect relationships in energy-flow, trophic structure and interspecific interactions. Am Nat. 1993;142:379–411.
    1. Pauly D, Christensen V, Dalsgaard J, Froese R, Torres F. Fishing down marine food webs. Science. 1998;279:860–863. - PubMed
    1. Ware DM, Thomson RE. Bottom-up ecosystem trophic dynamics determine fish production in the northeast Pacific. Science. 2005;308:1280–1284. - PubMed
    1. Richardson TL, Jackson GA. Small phytoplankton and carbon export from the surface ocean. Science. 2007;315:838–840. - PubMed
    1. Vander Zanden MJ, Rasmussen JB. A trophic position model of pelagic food webs: Impact on contaminant bioaccumulation in lake trout. Ecol Monogr. 1996;66:451–477.

Publication types