Comparative Study
. 2008 Dec;249(3):1026-33.
doi: 10.1148/radiol.2493080227.

Ankle: isotropic MR imaging with 3D-FSE-cube--initial experience in healthy volunteers

Affiliations
Comparative Study

Ankle: isotropic MR imaging with 3D-FSE-cube--initial experience in healthy volunteers

Kathryn J Stevens et al. Radiology. 2008 Dec.

Abstract

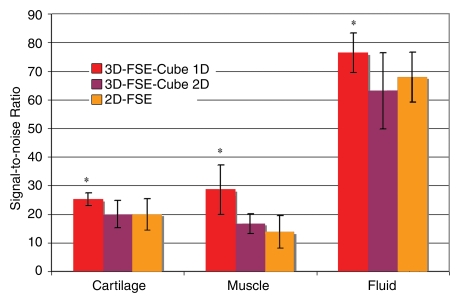
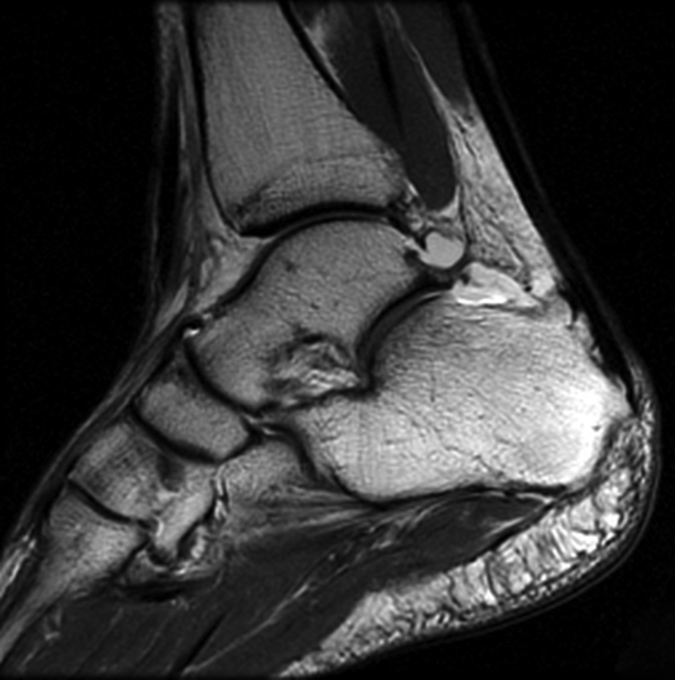
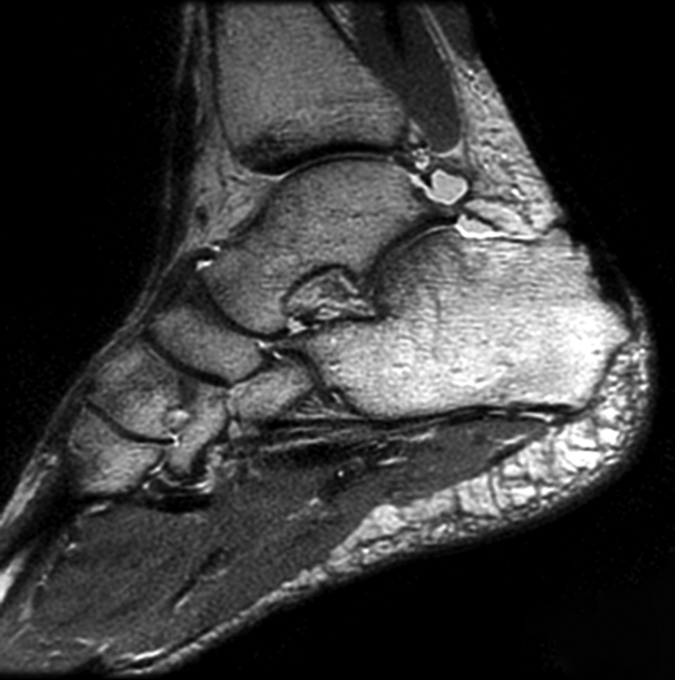
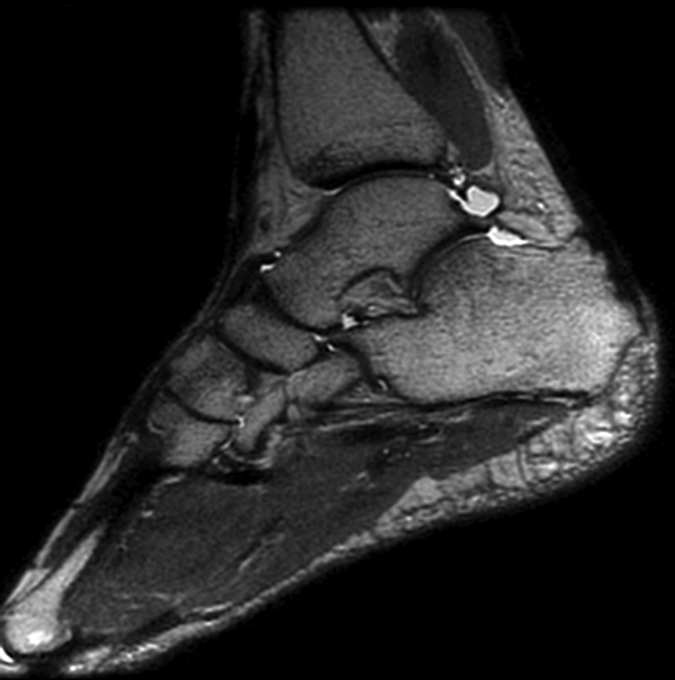
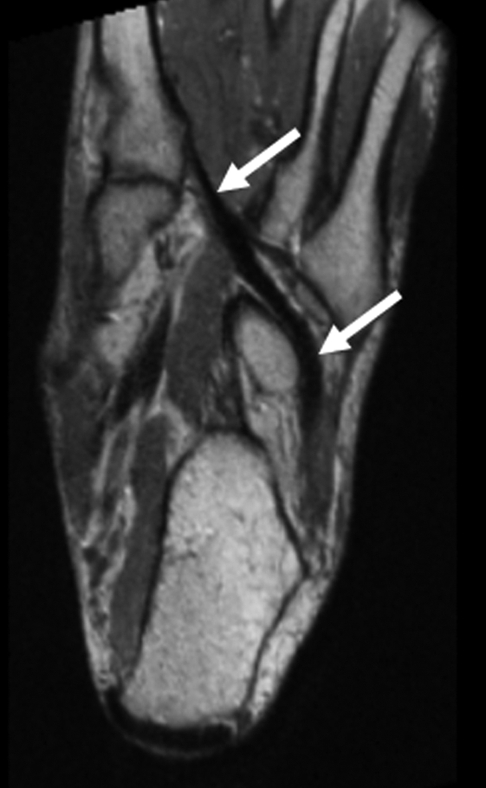
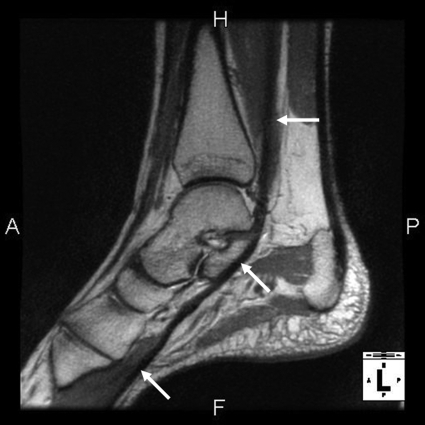
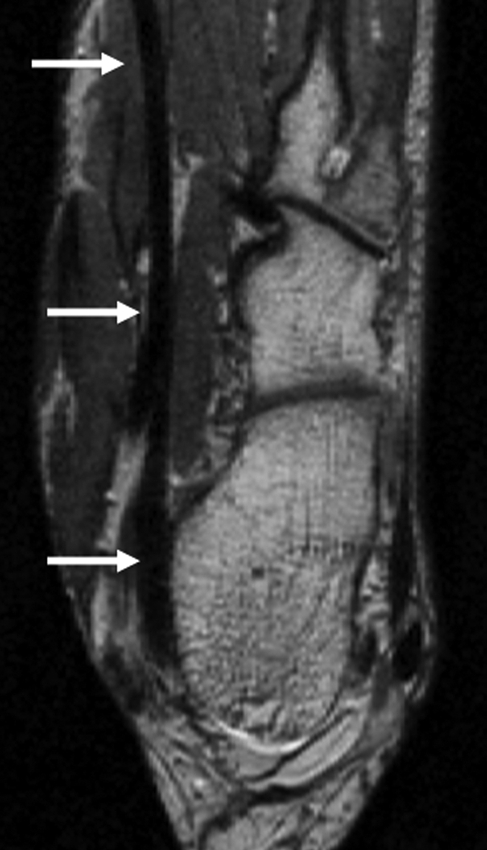
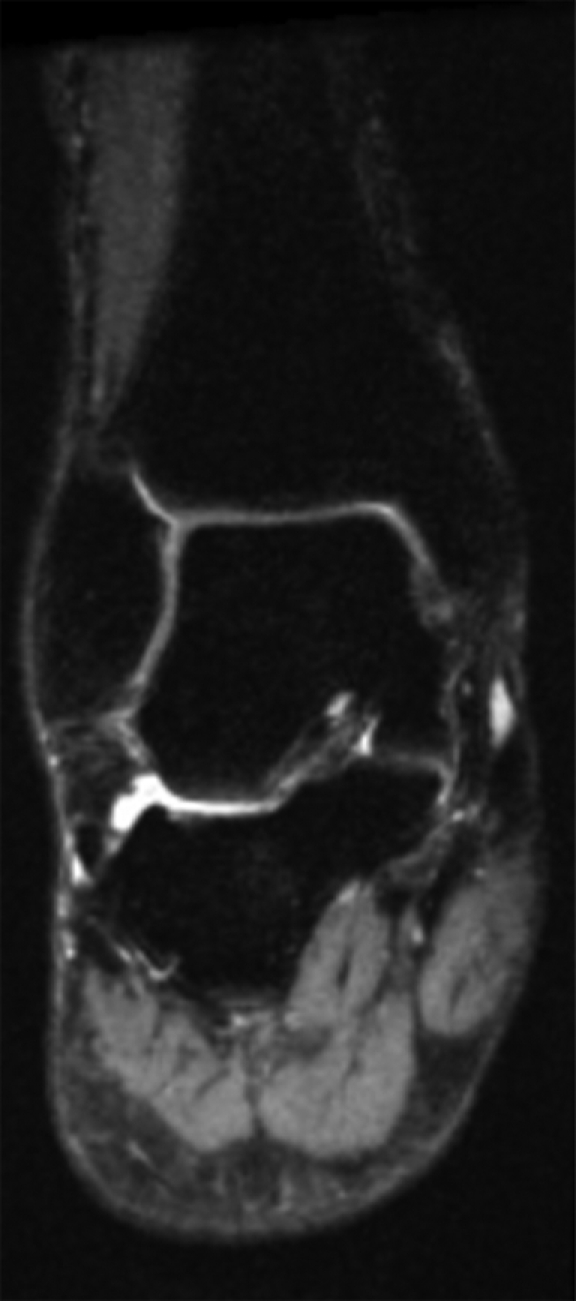
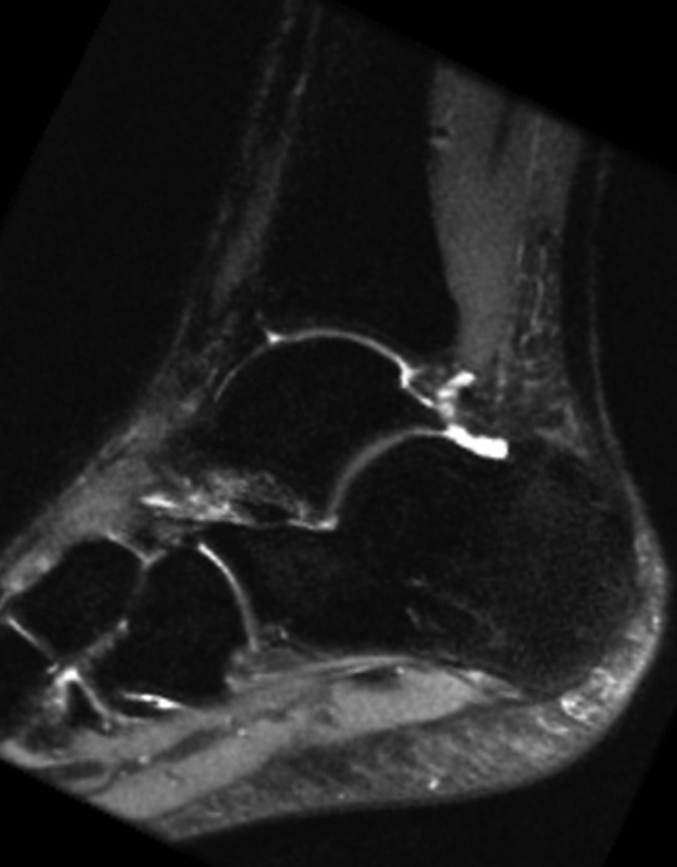
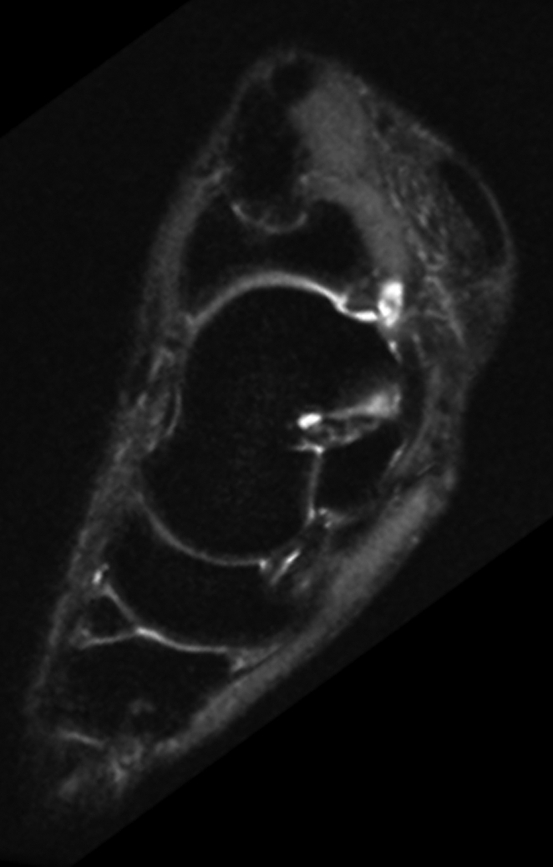
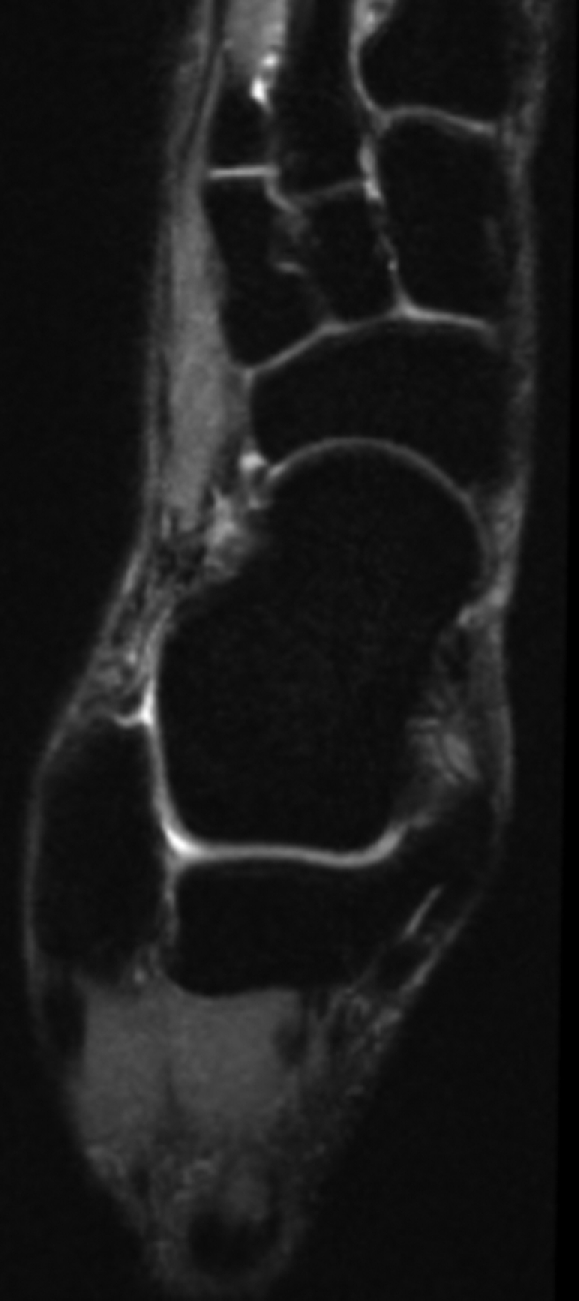
The purpose of this prospective study was to compare a new isotropic three-dimensional (3D) fast spin-echo (FSE) pulse sequence with parallel imaging and extended echo train acquisition (3D-FSE-Cube) with a conventional two-dimensional (2D) FSE sequence for magnetic resonance (MR) imaging of the ankle. After institutional review board approval and informed consent were obtained and in accordance with HIPAA privacy guidelines, MR imaging was performed in the ankles of 10 healthy volunteers (four men, six women; age range, 25-41 years). Imaging with the 3D-FSE-Cube sequence was performed at 3.0 T by using both one-dimensional- and 2D-accelerated autocalibrated parallel imaging to decrease imaging time. Signal-to-noise ratio (SNR) and contrast-to-noise ratio (CNR) with 3D-FSE-Cube were compared with those of the standard 2D FSE sequence. Cartilage, muscle, and fluid SNRs were significantly higher with the 3D-FSE-Cube sequence (P < .01 for all). Fluid-cartilage CNR was similar for both techniques. The two sequences were also compared for overall image quality, blurring, and artifacts. No significant difference for overall image quality and artifacts was demonstrated between the 2D FSE and 3D-FSE-Cube sequences, although the section thickness in 3D-FSE-Cube imaging was much thinner (0.6 mm). However, blurring was significantly greater on the 3D-FSE-Cube images (P < .04). The 3D-FSE-Cube sequence with isotropic resolution is a promising new MR imaging sequence for viewing complex joint anatomy.


Figures

Figure 1:
Figure 1:
Bar graph shows comparison of SNRs in cartilage, muscle, and fluid between 1D- and 2D-accelerated 3D-FSE-Cube MR imaging (3000/35) and 2D FSE MR imaging (3000/35). Images acquired with 1D-accelerated 3D-FSE-Cube had significantly higher SNR in all three tissues (* = P < .05) despite much thinner sections. The SNRs for all three tissues were similar for 2D accelerated 3D-FSE-Cube and 2D FSE (P > .1).
Figure 2a:
Figure 2a:
(a) Sagittal 2D FSE MR image (2-mm section thickness), (b) sagittal 3D-FSE-Cube with 1D acceleration MR image (0.6-mm section thickness), and (c) sagittal 3D-FSE-Cube with 2D acceleration MR image (0.6-mm section thickness) in healthy volunteer. Fluid is of high signal intensity in comparison to the articular cartilage.
Figure 2b:
Figure 2b:
(a) Sagittal 2D FSE MR image (2-mm section thickness), (b) sagittal 3D-FSE-Cube with 1D acceleration MR image (0.6-mm section thickness), and (c) sagittal 3D-FSE-Cube with 2D acceleration MR image (0.6-mm section thickness) in healthy volunteer. Fluid is of high signal intensity in comparison to the articular cartilage.
Figure 2c:
Figure 2c:
(a) Sagittal 2D FSE MR image (2-mm section thickness), (b) sagittal 3D-FSE-Cube with 1D acceleration MR image (0.6-mm section thickness), and (c) sagittal 3D-FSE-Cube with 2D acceleration MR image (0.6-mm section thickness) in healthy volunteer. Fluid is of high signal intensity in comparison to the articular cartilage.
Figure 3a:
Figure 3a:
(a) Sagittal 0.6-mm 3D-FSE-Cube MR image obtained with 1D acceleration and (b) sagittal 0.6-mm 3D-FSE-Cube MR image obtained with 1D acceleration with fat saturation. There is no substantial blurring on either image.
Figure 3b:
Figure 3b:
(a) Sagittal 0.6-mm 3D-FSE-Cube MR image obtained with 1D acceleration and (b) sagittal 0.6-mm 3D-FSE-Cube MR image obtained with 1D acceleration with fat saturation. There is no substantial blurring on either image.
Figure 4a:
Figure 4a:
(a–c) Axial oblique 3D-FSE-Cube MR images obtained with 1D acceleration in differing obliquities show anterior talofibular ligament (arrow in a). (b) By tilting the axial image a little more posteriorly, it is possible to see both the anterior (arrow) and posterior (arrowhead) talofibular ligaments on the same image. (c) Tilting the axial plane more posteriorly still allows the calcaneofibular ligament (arrows) to be seen in its entirety. (d) Sagittal 3D-FSE-Cube MR image depicts planes of a (A), b (B), and c (C).
Figure 4b:
Figure 4b:
(a–c) Axial oblique 3D-FSE-Cube MR images obtained with 1D acceleration in differing obliquities show anterior talofibular ligament (arrow in a). (b) By tilting the axial image a little more posteriorly, it is possible to see both the anterior (arrow) and posterior (arrowhead) talofibular ligaments on the same image. (c) Tilting the axial plane more posteriorly still allows the calcaneofibular ligament (arrows) to be seen in its entirety. (d) Sagittal 3D-FSE-Cube MR image depicts planes of a (A), b (B), and c (C).
Figure 4c:
Figure 4c:
(a–c) Axial oblique 3D-FSE-Cube MR images obtained with 1D acceleration in differing obliquities show anterior talofibular ligament (arrow in a). (b) By tilting the axial image a little more posteriorly, it is possible to see both the anterior (arrow) and posterior (arrowhead) talofibular ligaments on the same image. (c) Tilting the axial plane more posteriorly still allows the calcaneofibular ligament (arrows) to be seen in its entirety. (d) Sagittal 3D-FSE-Cube MR image depicts planes of a (A), b (B), and c (C).
Figure 4d:
Figure 4d:
(a–c) Axial oblique 3D-FSE-Cube MR images obtained with 1D acceleration in differing obliquities show anterior talofibular ligament (arrow in a). (b) By tilting the axial image a little more posteriorly, it is possible to see both the anterior (arrow) and posterior (arrowhead) talofibular ligaments on the same image. (c) Tilting the axial plane more posteriorly still allows the calcaneofibular ligament (arrows) to be seen in its entirety. (d) Sagittal 3D-FSE-Cube MR image depicts planes of a (A), b (B), and c (C).
Figure 5a:
Figure 5a:
(a, b) Sagittal oblique and (c) axial oblique 3D-FSE-Cube reformatted MR images show the course of the peroneal tendons. (a) The peroneus brevis tendon (arrows) grooves the posterior surface of the lateral malleolus to insert into the base of the fifth metatarsal. (b) The peroneus longus tendon (solid arrows) passes behind the lateral malleolus, inferior to the peroneal tubercle of the calcaneus (open arrow), to the undersurface of the cuboid bone. (c) The peroneus longus tendon (arrows) passes in a groove underneath the cuboid bone to insert into the base of the first metatarsal.
Figure 5b:
Figure 5b:
(a, b) Sagittal oblique and (c) axial oblique 3D-FSE-Cube reformatted MR images show the course of the peroneal tendons. (a) The peroneus brevis tendon (arrows) grooves the posterior surface of the lateral malleolus to insert into the base of the fifth metatarsal. (b) The peroneus longus tendon (solid arrows) passes behind the lateral malleolus, inferior to the peroneal tubercle of the calcaneus (open arrow), to the undersurface of the cuboid bone. (c) The peroneus longus tendon (arrows) passes in a groove underneath the cuboid bone to insert into the base of the first metatarsal.
Figure 5c:
Figure 5c:
(a, b) Sagittal oblique and (c) axial oblique 3D-FSE-Cube reformatted MR images show the course of the peroneal tendons. (a) The peroneus brevis tendon (arrows) grooves the posterior surface of the lateral malleolus to insert into the base of the fifth metatarsal. (b) The peroneus longus tendon (solid arrows) passes behind the lateral malleolus, inferior to the peroneal tubercle of the calcaneus (open arrow), to the undersurface of the cuboid bone. (c) The peroneus longus tendon (arrows) passes in a groove underneath the cuboid bone to insert into the base of the first metatarsal.
Figure 6a:
Figure 6a:
(a) Sagittal oblique and (b) axial oblique 3D-FSE-Cube reformatted MR images of left ankle show the flexor hallucis tendon (arrows) grooving the undersurface of the sustentaculum tali to pass toward the hallux (not included in the field of view). A = anterior, F = foot, H = head, P = posterior.
Figure 6b:
Figure 6b:
(a) Sagittal oblique and (b) axial oblique 3D-FSE-Cube reformatted MR images of left ankle show the flexor hallucis tendon (arrows) grooving the undersurface of the sustentaculum tali to pass toward the hallux (not included in the field of view). A = anterior, F = foot, H = head, P = posterior.
Figure 7a:
Figure 7a:
(a) Coronal and (b) sagittal 3D-FSE-Cube reformatted MR images with fat saturation show the articular cartilage of the tibial plafond and subtalar joints. However, 3D-FSE-Cube data can be reformatted in multiple imaging planes to view cartilage over areas of bone that are not easily seen with conventional orthogonal sequences. (c) Sagittal oblique 3D-FSE-Cube MR image shows cartilage over the lateral talar dome, where cartilage is usually thickest. (d) Axial oblique 3D-FSE-Cube MR image shows articular cartilage over the anterior tibiotalar joint, as well as in the intertarsal and tarsometatarsal joints.
Figure 7b:
Figure 7b:
(a) Coronal and (b) sagittal 3D-FSE-Cube reformatted MR images with fat saturation show the articular cartilage of the tibial plafond and subtalar joints. However, 3D-FSE-Cube data can be reformatted in multiple imaging planes to view cartilage over areas of bone that are not easily seen with conventional orthogonal sequences. (c) Sagittal oblique 3D-FSE-Cube MR image shows cartilage over the lateral talar dome, where cartilage is usually thickest. (d) Axial oblique 3D-FSE-Cube MR image shows articular cartilage over the anterior tibiotalar joint, as well as in the intertarsal and tarsometatarsal joints.
Figure 7c:
Figure 7c:
(a) Coronal and (b) sagittal 3D-FSE-Cube reformatted MR images with fat saturation show the articular cartilage of the tibial plafond and subtalar joints. However, 3D-FSE-Cube data can be reformatted in multiple imaging planes to view cartilage over areas of bone that are not easily seen with conventional orthogonal sequences. (c) Sagittal oblique 3D-FSE-Cube MR image shows cartilage over the lateral talar dome, where cartilage is usually thickest. (d) Axial oblique 3D-FSE-Cube MR image shows articular cartilage over the anterior tibiotalar joint, as well as in the intertarsal and tarsometatarsal joints.
Figure 7d:
Figure 7d:
(a) Coronal and (b) sagittal 3D-FSE-Cube reformatted MR images with fat saturation show the articular cartilage of the tibial plafond and subtalar joints. However, 3D-FSE-Cube data can be reformatted in multiple imaging planes to view cartilage over areas of bone that are not easily seen with conventional orthogonal sequences. (c) Sagittal oblique 3D-FSE-Cube MR image shows cartilage over the lateral talar dome, where cartilage is usually thickest. (d) Axial oblique 3D-FSE-Cube MR image shows articular cartilage over the anterior tibiotalar joint, as well as in the intertarsal and tarsometatarsal joints.

Similar articles

Cited by

References

    1. Fong DT, Hong Y, Chan LK, Yung PS, Chan KM. A systematic review on ankle injury and ankle sprain in sports. Sports Med 2007;37:73–94. - PubMed
    1. Kirby AB, Beall DP, Murphy MP, Ly JQ, Fish JR. Magnetic resonance imaging findings of chronic lateral ankle instability. Curr Probl Diagn Radiol 2005;34:196–203. - PubMed
    1. Cheung Y, Rosenberg ZS. MR imaging of ligamentous abnormalities of the ankle and foot. Magn Reson Imaging Clin N Am 2001;9:507–531, x. - PubMed
    1. Frey C, Bell J, Teresi L, Kerr R, Feder K. A comparison of MRI and clinical examination of acute lateral ankle sprains. Foot Ankle Int 1996;17:533–537. - PubMed
    1. Hepple S, Winson IG, Glew D. Osteochondral lesions of the talus: a revised classification. Foot Ankle Int 1999;20:789–793. - PubMed

Publication types