. 2008 Dec;11(12):1430-8.
doi: 10.1038/nn.2227. Epub 2008 Nov 16.

Motor modulation of afferent somatosensory circuits

Affiliations

Motor modulation of afferent somatosensory circuits

SooHyun Lee et al. Nat Neurosci. 2008 Dec.

Abstract

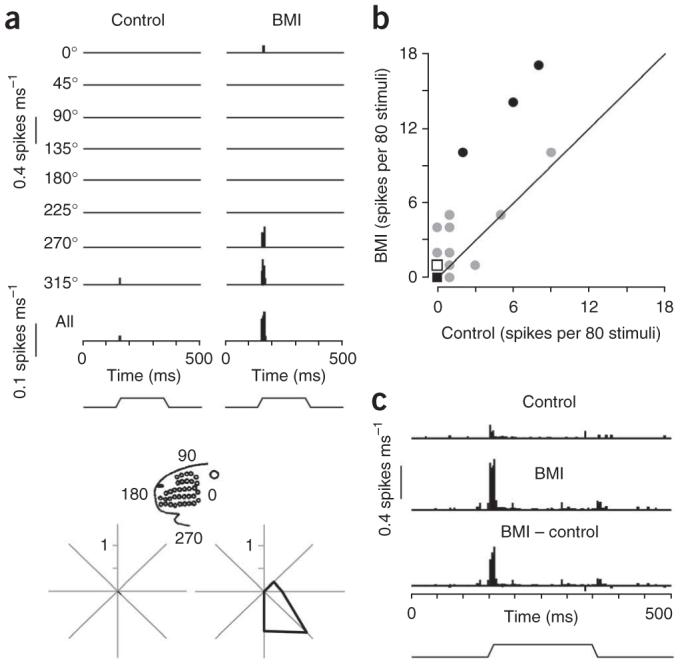
A prominent feature of thalamocortical circuitry in sensory systems is the extensive and highly organized feedback projection from the cortex to the thalamic neurons that provide stimulus-specific input to the cortex. In lightly sedated rats, we found that focal enhancement of motor cortex activity facilitated sensory-evoked responses of topographically aligned neurons in primary somatosensory cortex, including antidromically identified corticothalamic cells; similar effects were observed in ventral posterior medial thalamus (VPm). In behaving rats, thalamic responses were normally smaller during whisking but larger when signal transmission in brainstem trigeminal nuclei was bypassed or altered. During voluntary movement, sensory activity may be globally suppressed in the brainstem, whereas signaling by cortically facilitated VPm neurons is simultaneously enhanced relative to other VPm neurons receiving no such facilitation.


Figures

Figure 1
Figure 1
The effect of BMI micro-iontophoresis on vFMCx and S1 L-6 neurons. (a) PSTHs show spontaneous MUA recorded from vFMCx during 80 500-ms epochs. Application of 10 mM BMI for 5 min caused an ∼threefold increase in MUA. MUA returned to baseline within 30 min of cessation of BMI application. (b) MUA was normalized to activity during control conditions for 21 BMI applications in four experiments. Error bars indicate mean ± s.e.m. ** P < 0.005, paired t test. (c) The spread of BMI’s effect was evaluated by recording MUA simultaneously from four electrodes placed ∼500 μm apart horizontally at a depth of 1,500 μm. One electrode delivered BMI (black solid line). BMI application for 10 min (gray area) increased MUA at the delivery site but minimally affected responses at other locations. (d) Histological localization of the recording sites. A small electrolytic lesion was made at each site (arrow and arrowheads). Numbers indicate the sites for data shown in c. Horizontal section (70 μm) was processed for cytochrome oxidase with thionin counterstain. Site 1 (full arrow) indicates the site of BMI application. Scale bar represents 500 μm. Inset, gray rectangle indicates the region shown in the photomicrograph and the dot represents the approximate location of bregma. (e) Effect of vFMCx activation on S1 L-6 neurons. ON response magnitudes for 29 topographically aligned and 12 nonaligned neurons were plotted for control and BMI conditions. Individual neurons showing a significant difference are indicated as closed circles (P < 0.05).
Figure 2
Figure 2
Effects of vFMCx activation on antidromically identified corticothalamic neurons in S1. (a) PSTHs show accumulated responses of a corticothalamic neuron (recording depth, 1,680 μm) to principal whisker deflection before and during vFMCx activation by BMI micro-iontophoresis. The principal whisker was deflected ten times at eight different angles and the response accumulated over all of the angles is shown in the bottom PSTH. The vertical scale represents the spike probability per 1-ms bin. Stimulus waveform is indicated below. Polar plots illustrate responses to stimulus onsets in polar coordinates (spikes per stimulus). Inset indicates orientation with respect to the face. (b) vFMCx activation by BMI micro-iontophoresis increased principal whisker-evoked responses of topographically aligned corticothalamic neurons (n = 38). ON responses are spike counts during a 30-ms period following deflection onsets. Gray line denotes unity. Individual neurons showing a significant difference are indicated as closed circles (P < 0.05). Note that many data points near 0 are superimposed (circle, n = 1; closed square, n = 19; open square, n = 5 and that one data point (x, y = 1, 30) is not plotted to preserve clarity of the plot. (c) Population all-angle PSTHs were constructed from all corticothalamic neurons. Data are presented as in a.
Figure 3
Figure 3
The effect of vFMCx activation on VPm neurons. (a) PSTHs from a neuron in topographically aligned VPm. (b) Data from 36 neurons in aligned VPm. Individual neurons showing a significant difference in ON response are indicated as closed circles (P < 0.05). Data are presented as in Figure 2b. (c) Topographically specific effect of BMI application to vFMCx on thalamic barreloid neurons. Proportional changes in ON responses to principal whisker deflection by vFMCx BMI were compared in nine pairs of simultaneously recorded neurons from aligned and nonaligned VPm sites relative to vFMCx BMI site. Values > 1.0 indicate VPm response facilitation during BMI condition. (d) Normalized VPm responses during vFMCx BMI application versus the control condition (* P = 0.05, paired t test). (e) vFMCx affected VPm neurons after ablation of corticobulbar fibers. Multiple, small electrolytic lesions were produced in the right cerebral peduncle before recordings. The scatter plot shows the effects in 11 aligned neurons studied in two experiments. Individual neurons showing a significant difference (P < 0.05, paired t test) are indicated as closed circles. Data are presented as in Figure 2b. (f) Photomicrographs of coronal sections through the caudal end of the diencephalon; arrow in lower section indicates damaged fiber tract in the right hemisphere (reversed in figure). Scale bar represents 3.0 mm.
Figure 4
Figure 4
Whisker follicle stimulation-evoked VPm LFPs during whisking and nonwhisking conditions. (a) The evoked LFP was larger during nonwhisking than during whisking; the LFP was averaged from 175 whisking and 211 nonwhisking whisker follicle stimuli. Solid arrowhead in nonwhisking trace denotes peak LFP negativity. Verticals lines indicate peak LFP amplitudes. Inset shows full traces including stimulus artifact (open arrowhead) and the evoked LFP. The evoked LFPs in the inset (indicated by a horizontal bar) are shown at an expanded scale below. (b) PSTHs of simultaneously recorded MUA (0.1-ms bins). Whisker follicle stimulation evoked fewer spikes during whisking periods. LFP traces in a and PSTHs in b are temporally aligned. MUA spike counts were measured during a 1-ms window starting 2.5 ms after the whisker follicle stimulus. (c) Whisker follicle stimulation-evoked LFPs (n = 8 sessions). Peak-to-peak LFP amplitudes during whisking were normalized to values during nonwhisking (P = 0.02, Wilcoxon signed-rank test). The box plots indicate 25-75 percentile range and the line in the box indicates median. Data from each recording session in which there was a significant difference between whisking and nonwhisking are indicated as closed circles (P < 0.05, Mann-Whitney tests). (d) Whisker follicle stimulation-evoked MUAs (n = 6 sessions). Evoked spikes were normalized to values during nonwhisking (P = 0.03, Wilcoxon signed-rank test). Data are presented as in c.
Figure 5
Figure 5
Medial lemniscal stimulation-evoked VPm LFPs. (a) Evoked LFPs, both early and late components, were larger during whisking than during nonwhisking; arrow indicates early and solid arrowhead indicates late negativities. LFPs were determined on the basis of 379 nonwhisking and 207 whisking stimuli. Inset shows full traces, including stimulus artifact (open arrowhead) and evoked responses (dashed ellipse). (b) PSTHs of simultaneously recorded MUA (0.1-ms bins). Because the beginning of the thalamic spiking response was obscured by the stimulus artifact, MUA spike counts were taken only during the late-response component, corresponding to the second positive-to-negative slope. Data are presented as in Figure 4b. (c) Medial lemniscus stimulation evoked proportionally larger early and late VPm responses during whisking (P < 0.005, Wilcoxon signed-rank tests). LFP amplitudes during whisking were normalized to those during nonwhisking. Data are presented as in Figure 4c.
Figure 6
Figure 6
Paired-pulse medial lemniscal stimulation. (a) LFP was larger during whisking (P < 0.0005, Mann-Whitney test; whisking, n = 207 stimuli; nonwhisking, n = 417). Paired-pulse suppression (25-ms interval) was less robust during whisking. Note that the late response to the second pulse was barely detectable during nonwhisking (dashed ellipse). (b) PSTHs of simultaneously recorded MUA (0.1-ms bins). Spike counts were larger during whisking in response to the second stimulus, and there was less paired-pulse suppression. Data are presented as in Figure 4b.(c) Adaptation of thalamic responses to paired-pulse medial lemniscus stimulation during whisking and nonwhisking periods. Paired-pulse adaptation indices for seven recording sessions are calculated as the ratio of MUA spikes counts evoked by the second pulse to those evoked by the first pulse. The gray line indicates the unity line.
Figure 7
Figure 7
Contrasting effects of whisker follicle and medial lemniscus stimulation in the same animal. (a,b) VPm LFPs evoked by interleaved (a) whisker follicle stimulation and (b) medial lemniscus stimulation in one animal during a single recording session. Whisker follicle stimulation evoked a smaller response during whisking, whereas medial lemniscus stimulation evoked a larger response. Arrows indicate evoked LFP negativity.
Figure 8
Figure 8
Whisker follicle stimulation evokes larger VPm responses during whisking when SpVi is inactivated. (a) When SpVi was inactivated by bupivacaine infusion, the response to whisker follicle stimulation during whisking was larger than during nonwhisking, the converse of the control condition. (b) Damage to SpVi resulted in a larger whisker follicle-evoked VPm during whisking than during nonwhisking, regardless of infusion of bupivacaine into SpVi. (c) Photomicrographs of coronal sections through SpVi, demarcated by white lines. Arrow indicates histological localization of the implanted cannula (left). Severe damage to SpVi by the implanted cannula is evident in the middle section. The line drawing shows the location of SpVi at 13.24 mm posterior to bregma. Scale bar represents 1 mm and applies to all three images. 4V, fourth ventricle; ML, medial lemniscus; Py, pyramidal tract. (d) Larger VPm responses to whisker follicle stimulation were observed during whisking in SpVi-inactivated or SpVi-damaged rats. Peak of LFP during whisking was normalized to the peak LFP during nonwhisking for each recording session. The gray dotted line at 1.0 indicates no changes.

Comment in

  • And motion changes it all.
    Ahissar E. Ahissar E. Nat Neurosci. 2008 Dec;11(12):1369-70. doi: 10.1038/nn1208-1369. Nat Neurosci. 2008. PMID: 19023341 No abstract available.

References

    1. Ahissar E, Kleinfeld D. Closed-loop neuronal computations: focus on vibrissa somatosensation in rat. Cereb. Cortex. 2003;13:53–62. - PubMed
    1. Carvell GE, Miller SA, Simons DJ. The relationship of vibrissal motor cortex unit activity to whisking in the awake rat. Somatosens. Mot. Res. 1996;13:115–127. - PubMed
    1. Fanselow EE, Nicolelis MA. Behavioral modulation of tactile responses in the rat somatosensory system. J. Neurosci. 1999;19:7603–7616. - PMC - PubMed
    1. Krupa DJ, Wiest MC, Shuler MG, Laubach M, Nicolelis MA. Layer-specific somatosensory cortical activation during active tactile discrimination. Science. 2004;304:1989–1992. - PubMed
    1. Hentschke H, Haiss F, Schwarz C. Central signals rapidly switch tactile processing in rat barrel cortex during whisker movements. Cereb. Cortex. 2006;16:1142–1156. - PubMed

Publication types

MeSH terms