

Meta-analysis of genome-wide association data identifies four new susceptibility loci for colorectal cancer
- PMID: 19011631
- PMCID: PMC2836775
- DOI: 10.1038/ng.262
Meta-analysis of genome-wide association data identifies four new susceptibility loci for colorectal cancer
Abstract
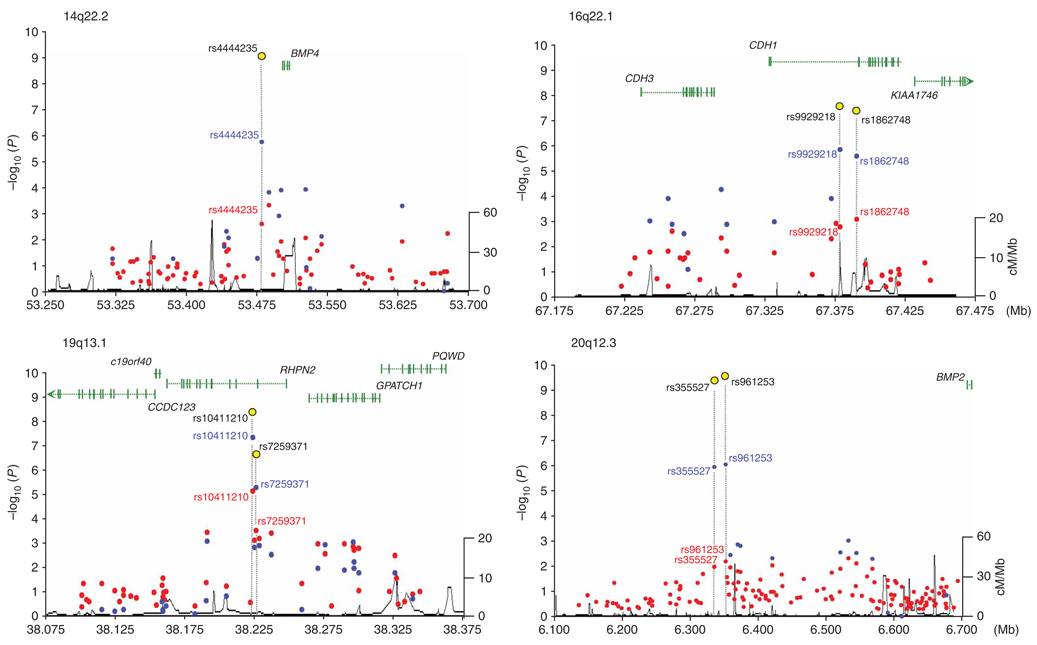
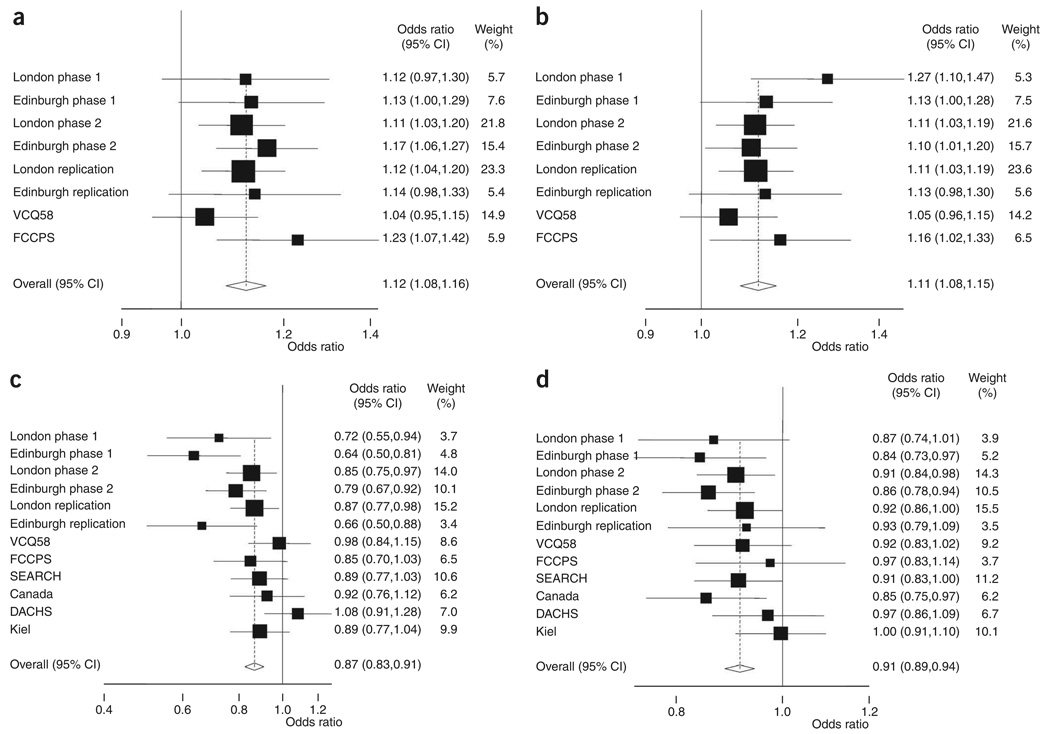
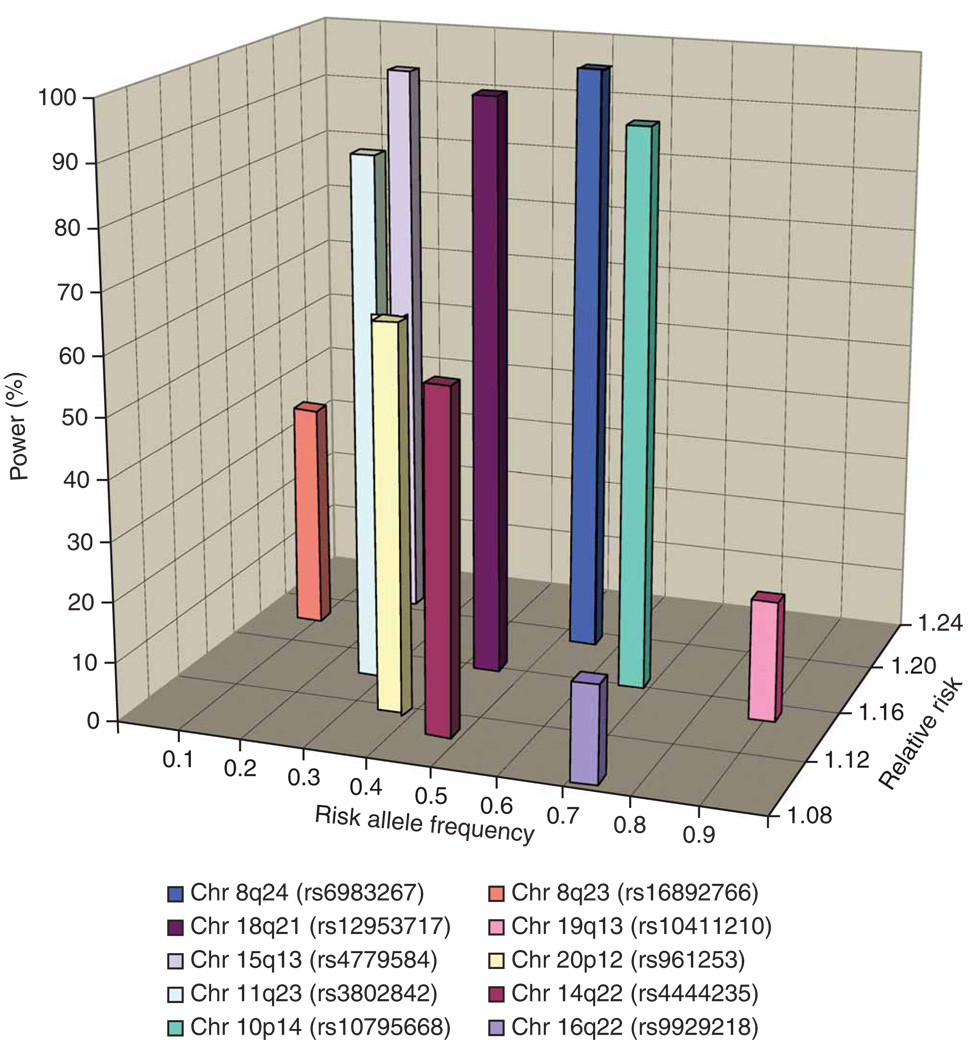
Genome-wide association (GWA) studies have identified multiple loci at which common variants modestly influence the risk of developing colorectal cancer (CRC). To enhance power to identify additional loci with similar effect sizes, we conducted a meta-analysis of two GWA studies, comprising 13,315 individuals genotyped for 38,710 common tagging SNPs. We undertook replication testing in up to eight independent case-control series comprising 27,418 subjects. We identified four previously unreported CRC risk loci at 14q22.2 (rs4444235, BMP4; P = 8.1 x 10(-10)), 16q22.1 (rs9929218, CDH1; P = 1.2 x 10(-8)), 19q13.1 (rs10411210, RHPN2; P = 4.6 x 10(-9)) and 20p12.3 (rs961253; P = 2.0 x 10(-10)). These findings underscore the value of large sample series for discovery and follow-up of genetic variants contributing to the etiology of CRC.
Figures
References
-
- Lichtenstein P, et al. Environmental and heritable factors in the causation of cancer—analyses of cohorts of twins from Sweden, Denmark, and Finland. N. Engl. J. Med. 2000;343:78–85. - PubMed
-
- Aaltonen L, Johns L, Jarvinen H, Mecklin JP, Houlston R. Explaining the familial colorectal cancer risk associated with mismatch repair (MMR)-deficient and MMR-stable tumors. Clin. Cancer Res. 2007;13:356–361. - PubMed
-
- Tomlinson I, et al. A genome-wide association scan of tag SNPs identifies a susceptibility variant for colorectal cancer at 8q24.21. Nat. Genet. 2007;39:984–988. - PubMed
-
- Zanke BW, et al. Genome-wide association scan identifies a colorectal cancer susceptibility locus on chromosome 8q24. Nat. Genet. 2007;39:989–994. - PubMed
-
- Tomlinson IP, et al. A genome-wide association study identifies colorectal cancer susceptibility loci on chromosomes 10p14 and 8q23.3. Nat. Genet. 2008;40:623–630. - PubMed
Publication types
MeSH terms
Grants and funding
- G0000657-53203/MRC_/Medical Research Council/United Kingdom
- K/OPR/2/2/D333/CSO_/Chief Scientist Office/United Kingdom
- G0000934/MRC_/Medical Research Council/United Kingdom
- A8896/CRUK_/Cancer Research UK/United Kingdom
- U24 CA074783/CA/NCI NIH HHS/United States
- MC_U127527198/MRC_/Medical Research Council/United Kingdom
- U01 CA076783/CA/NCI NIH HHS/United States
- CA95011/CA/NCI NIH HHS/United States
- U01 CA074783/CA/NCI NIH HHS/United States
- A6360/CRUK_/Cancer Research UK/United Kingdom
- CZB/4/449/CSO_/Chief Scientist Office/United Kingdom
- C1298/A8362/CRUK_/Cancer Research UK/United Kingdom
- C348/A3758/CRUK_/Cancer Research UK/United Kingdom
- G0301096/MRC_/Medical Research Council/United Kingdom
- C48/A6361/CRUK_/Cancer Research UK/United Kingdom
- WT_/Wellcome Trust/United Kingdom
LinkOut - more resources
Full Text Sources
Other Literature Sources
Medical
Miscellaneous
