. 2008 Dec;15(12):1263-71.
doi: 10.1038/nsmb.1514. Epub 2008 Nov 16.

Single-RNA counting reveals alternative modes of gene expression in yeast

Affiliations

Single-RNA counting reveals alternative modes of gene expression in yeast

Daniel Zenklusen et al. Nat Struct Mol Biol. 2008 Dec.

Abstract

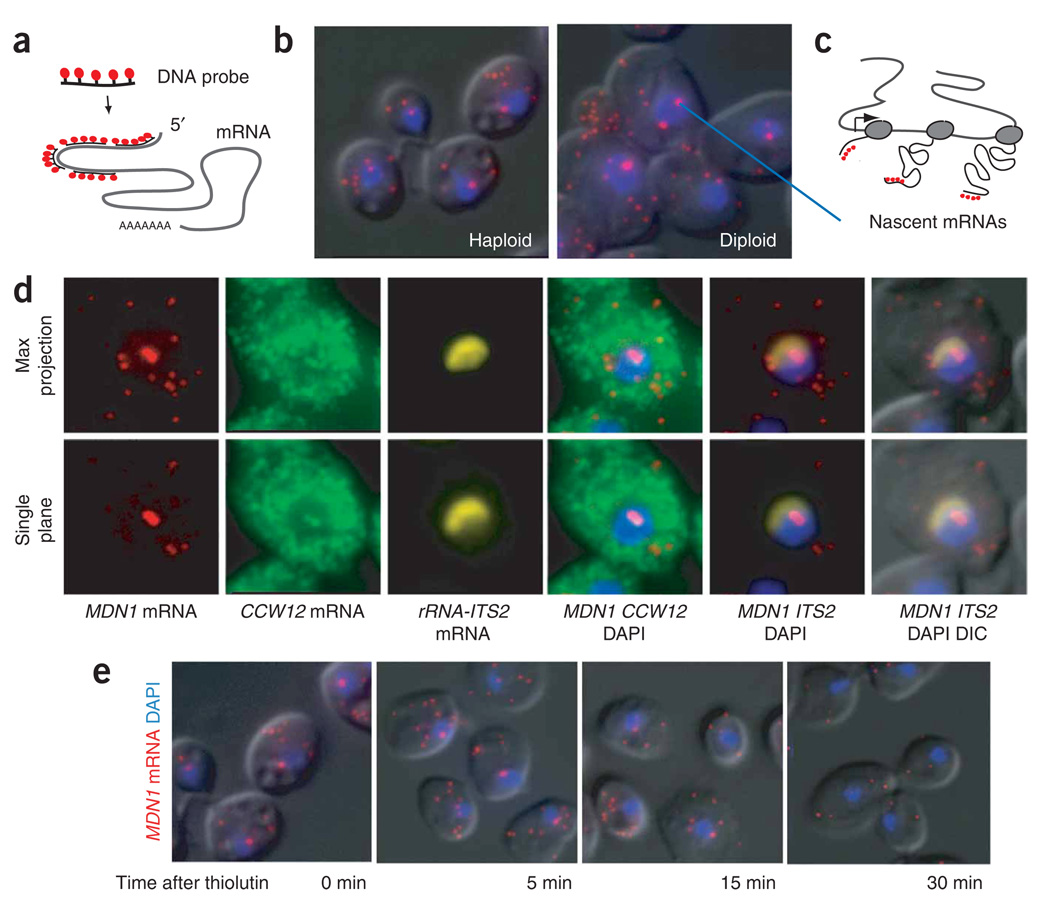
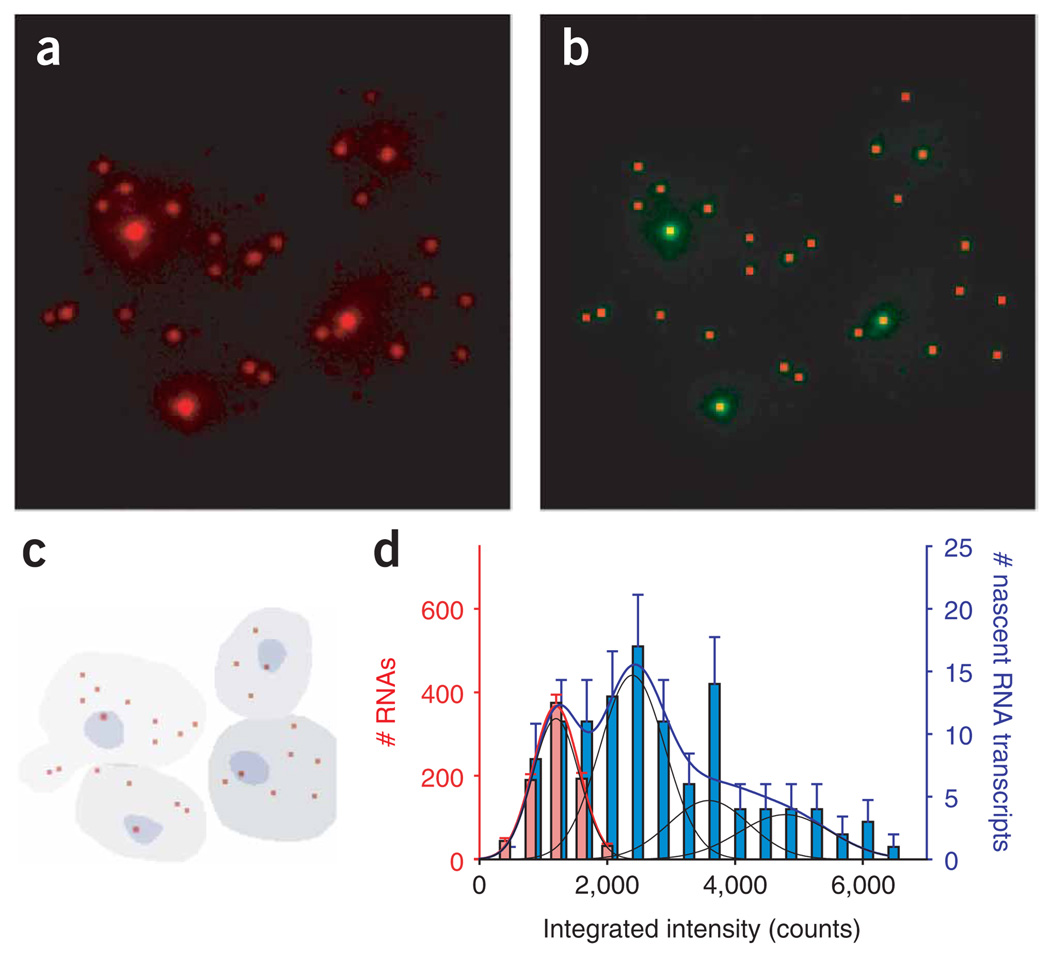
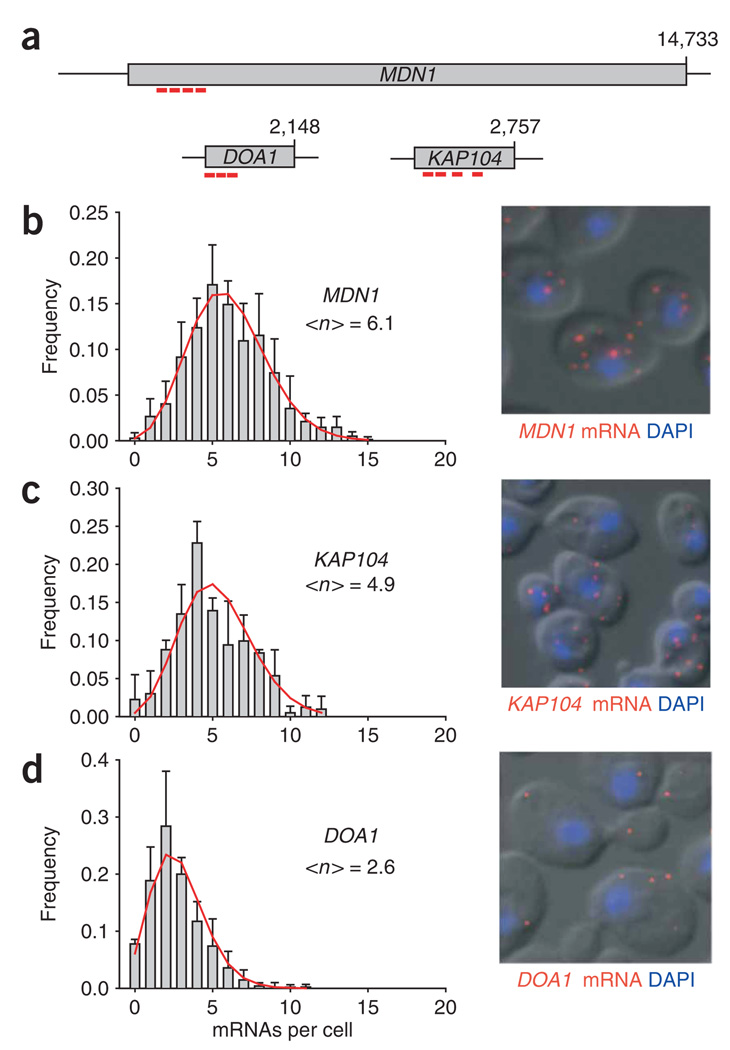
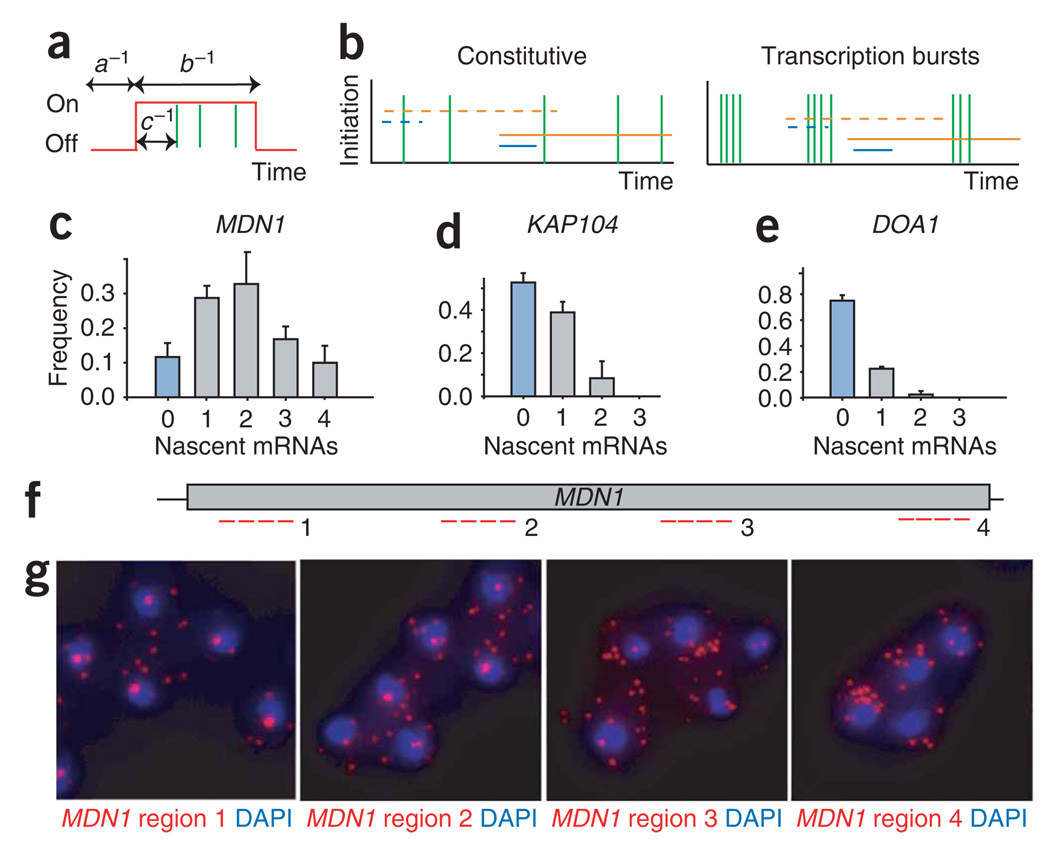
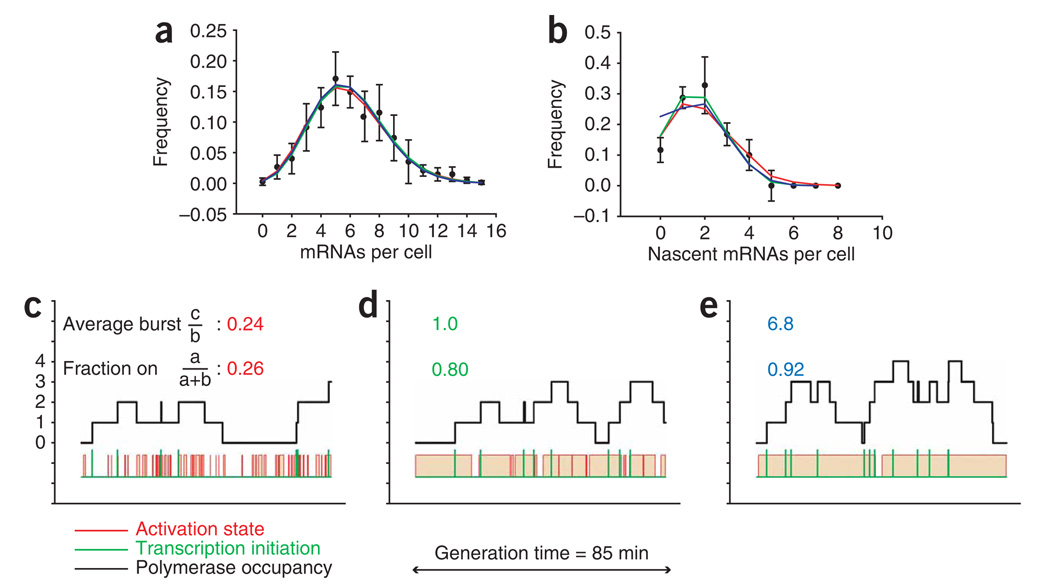
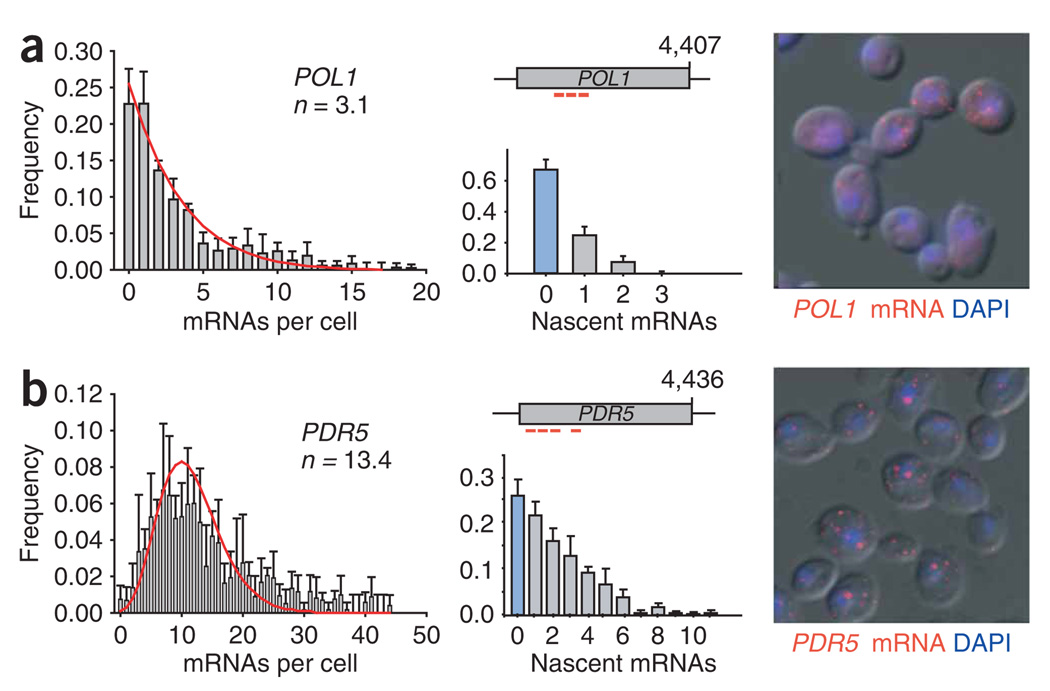
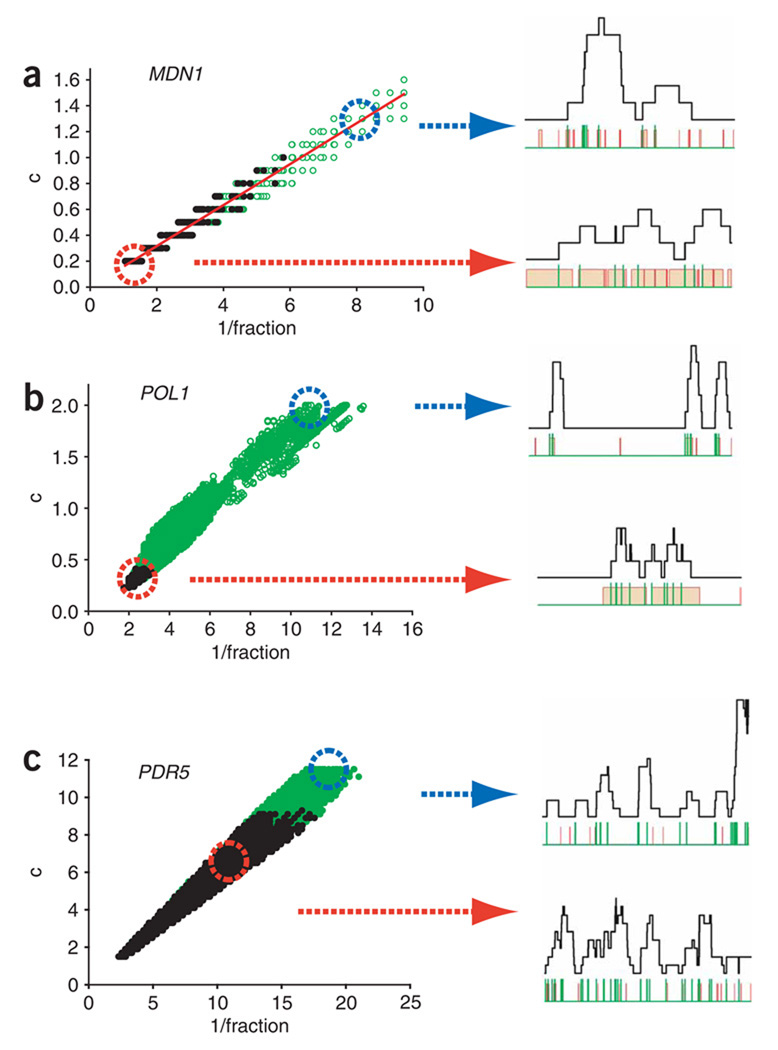
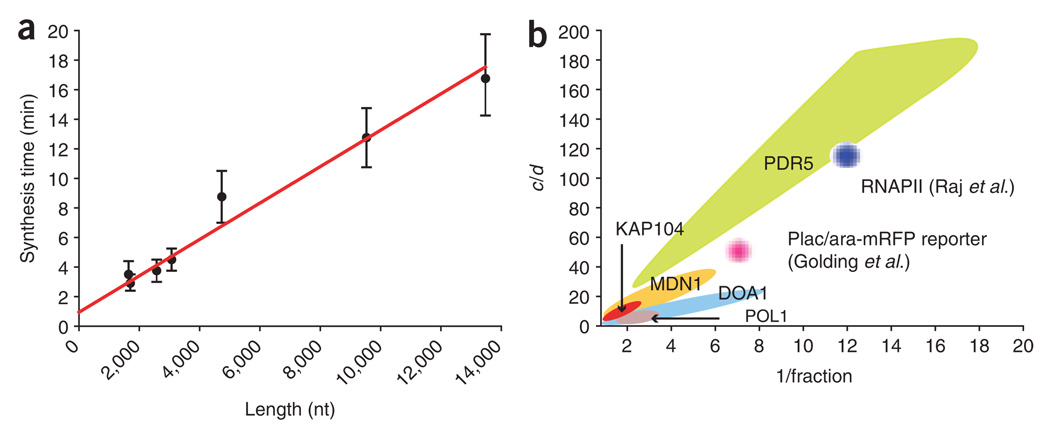
Proper execution of transcriptional programs is a key requirement of gene expression regulation, demanding accurate control of timing and amplitude. How precisely the transcription machinery fulfills this task is not known. Using an in situ hybridization approach that detects single mRNA molecules, we measured mRNA abundance and transcriptional activity within single Saccharomyces cerevisiae cells. We found that expression levels for particular genes are higher than initially reported and can vary substantially among cells. However, variability for most constitutively expressed genes is unexpectedly small. Combining single-transcript measurements with computational modeling indicates that low expression variation is achieved by transcribing genes using single transcription-initiation events that are clearly separated in time, rather than by transcriptional bursts. In contrast, PDR5, a gene regulated by the transcription coactivator complex SAGA, is expressed using transcription bursts, resulting in larger variation. These data directly demonstrate the existence of multiple expression modes used to modulate the transcriptome.


Figures

Figure 1
Figure 1
Single mRNA–sensitivity FISH. (a) Schematic diagram of the FISH protocol. A mixture of four 50-nt DNA oligonucleotides, each labeled with five fluorescent dyes, is hybridized to paraformaldehyde-fixed yeast cells to obtain a single-transcript resolution. (b) Single-mRNA FISH for MDN1 mRNA. Single mRNAs are detected in the cytoplasm, with a higher intensity spot in the nucleus. Haploid and diploid yeast cells are shown. Probes hybridize to the 5′ end of the mRNA. MDNI mRNA, red; DAPI, blue; superimposed on the differential interference contrast (DIC) image. (c) Cartoon showing how the number of nascent mRNAs at the site of transcription is used to determine the polymerase loading on a gene when using FISH probes that hybridize to the 5′ end of the gene. (d) Nascent transcripts of neighboring genes colocalize at the site of transcription. Diploid cells are hybridized with probes against MDN1 (labeled with cy3) and CCW12 (labeled with cy3.5). The nucleolus is stained with probes against the ITS2 spacer of the ribosomal RNA precursor (labeled with Cy5). Maximum projection of a three-dimensional data set and single plane containing the transcription sites is shown. (e) Nascent-transcript detection requires ongoing transcription. Cells were fixed 0, 5, 15 and 30 min after addition of the transcription inhibitor thiolutin (4ug ml−1) to the media. FISH was carried out using probes to MDN1 mRNA as shown in b. Representative cells are shown for each time point.
Figure 2
Figure 2
Quantitative single-molecule, single-cell gene expression analysis. (a,b) A spot-detection algorithm detects and quantifies FISH signals. Red dots in b show signals identified by the spot-detection software from the raw signals in a. (c) The nucleus and cytoplasm were segmented using a hand-drawn mask (cellular boundaries) and DAPI thresholding (nucleus). (d) Histogram of cytoplasmic (left axis, red bars) and nuclear (right axis, blue bars) signal intensities of MDN1 signals from multiple fields, determined using the spot-detection algorithm. The cytoplasmic mRNA intensities fit to a Gaussian distribution (red line), and the mean is used as the brightness of a single transcript. The nuclear signal intensities (assembly of nascent mRNAs associated with the gene) fit with multiple Gaussian distributions (blue line), where the mean of each Gaussian distribution is an integer multiple of the single-peak intensity. The width of each peak also scales with the mean, as expected for Poisson noise in spot localization. The individual contributions to the composite fit are shown in black. Error bars indicate s.e.m.
Figure 3
Figure 3
Expression profiles of constitutively active genes. (a) Cartoon showing the position of the FISH probes used according to their target region on the corresponding mRNAs. (b–d) mRNA expression profiles of different yeast genes shown in a were determined using FISH. Frequency (y axis) of mRNA numbers (x axis) per cell determined for MDN1, KAP104 and DOA1 are shown. <n> shows the average number of mRNAs per cell. Red lines in b–d show fits describing the expression kinetics (see text). Error bars indicate s.e.m. Representative FISH images (mRNA, red; DAPI, blue) superimposed on the differential interference contrast (DIC) are shown on the right.
Figure 4
Figure 4
Transcriptional loading determines the mode of transcription. (a) Gene-activation and -inactivation model used to simulate the expression kinetics. The gene transitions to the on state (red line, high) with rate a and to the off state (red line, low) with rate b. The initiation rate from the on state is c, and initiation events are denoted by a vertical green hash mark. The average time intervals are a−1, b−1 and c−1, respectively. (b) Alternative transcription modes. In the constitutive transcription mode, individual initiation events are clearly separated in time, whereas for transcription bursts multiple transcripts are produced within short time intervals followed by long periods of transcription inactivity. Initiation of a single transcript is shown as a green vertical line. Red and blue lines indicate the time the polymerase needs to synthesize an mRNA and is therefore equal to the time an mRNA stays at the site of transcription. On a long gene (orange), constitutive and bursting transcription can lead to similar distributions. On short genes (blue), bursting and constitutive expression lead to different distributions. Full and broken lines show two time points when cells are fixed. (c–e) Transcription status profiles of MDN1, KAP104 and DOA1 determined using FISH. The frequency (y axis) of the number of nascent transcripts (x axis) per cell is shown. The fraction of cells not containing an active site of transcription are highlighted in blue. Error bars indicate s.e.m. (f) Position of FISH probes to different region on the MDN1 gene. (g) Polymerases do not cluster on the MDN1 gene. MDN1 mRNA FISH using cy3-labeled probes to regions 1, 2, 3 and 4 on MDN1. RNA, red; DNA stained with DAPI, blue.
Figure 5
Figure 5
Modeling MDN1 expression kinetics. (a,b) mRNA abundance (χN2<2.4, a) and nascent transcripts (χm2<9.15, b) for MDN1 fit with a model based on the scheme in a. Three different scenarios with different values for a, b and c are shown (red, green and blue curves, respectively). Error bars indicate s.e.m. (c–e) Representative Monte Carlo time traces of transcription, where c (red), d (green) and e (blue) show a different set of rate constants a, b and c, corresponding to the curves in a and b. The black curve is the polymerase-occupancy level on the gene; the red curve is the on/off state of the gene; the green curve marks initiation events. The average burst size and fraction of time spent in the on state are shown above each time trace.
Figure 6
Figure 6
Expression profiles of a cell cycle–regulated and a SAGA-controlled gene. mRNA expression and transcription status profiles of POL1 (a) and PDR5 (b), as determined using FISH. Frequency (y axis) of the number of cytoplasmic mRNAs (left) and nascent transcripts (below middle) (x axis) per cell are shown. <n> shows the average number of mRNAs per cell. Fractions of cells not containing an active site of transcription are highlighted in blue. Error bars indicate s.e.m. Above middle, position of FISH probes. Representative FISH images (mRNA, red; DAPI, blue) superimposed on the differential interference contrast (DIC) are shown on the right.
Figure 7
Figure 7
Transcription kinetics of endogenous yeast genes. (a) The combinations of transcription rate constants that result in statistically significant models for MDN1 are shown as circles designating a particular value of a, b and c (min−1), with τ implicit. 1/fraction = (a + b)/a. Models that fit the mRNA abundance only are shown in open green circles; models that fit both the mRNA abundance and the nascent-mRNA loading are shown in closed black circles (χ2 significance level = 0.10). Simulated Monte Carlo time traces for MDN1 transcription using the parameters corresponding to the parameters used for the regions in red and blue circles are shown on the right. The black line shows the occupancy level of the gene; the red line shows the activation state of the gene (high = active, low = inactive); the vertical green lines mark single initiation events. (b,c) Parameters describing the expression kinetics of POL1 and PDR5.
Figure 8
Figure 8
Extracting kinetic data from fixed-cell analysis. (a) Determining polymerase speed from FISH data. The synthesis time (τ) is plotted against the length of the gene. The length is determined from the position of the FISH probe nearest the 3′ end of the gene. Error bars indicate s.d. determined from the model by allowing τ to vary for a fixed set of a, b and c parameters. The slope of the line gives (polymerase speed)−1, resulting in a speed of 0.80 ± 0.07 kb min−1; the y intercept corresponds to a termination time of 56 ± 20 s. The individual data points correspond to the previously described genes (KAP104, DOA1, MDN1, POL1 and PDR5) and multiple regions of MDN1. (b) The parameters space for endogenous gene transcription. The statistically significant models for each gene are presented as in Figure 7. The y axis is the initiation rate constant c normalized by the mRNA decay constant d, which allows for comparison between genes. 1/fraction = (a + b)/a. For the genes studied in this report (MDN1, KAP104, DOA1, POL1, PDR5), the colored regions represent the actual parameter space for a, b and c. For the genes described in previous reports,, the full parameter space was not reported. The approximate value of a, b and c is based on the findings of these authors (Raj et al.: c/d ~ 120; 1/f ~ 12. Golding et al.: c/d ~ 50; 1/f ~7), but the physical extent of these regions as depicted in b is only for graphic display.

References

    1. Orphanides G, Reinberg D. A unified theory of gene expression. Cell. 2002;108:439–451. - PubMed
    1. Thomas MC, Chiang C-M. Thegeneral transcription machinery and general cofactors. Crit. Rev. Biochem. Mol. Biol. 2006;41:105–178. - PubMed
    1. Dieci G, Sentenac A. Detours and shortcuts to transcription reinitiation. Trends Biochem. Sci. 2003;28:202–209. - PubMed
    1. Li B, Carey M, Workman JL. The role of chromatin during transcription. Cell. 2007;128:707–719. - PubMed
    1. Saunders A, Core LJ, Lis JT. Breaking barriers to transcription elongation. Nat. Rev. Mol. Cell Biol. 2006;7:557–567. - PubMed

Publication types

MeSH terms