. 2008;3(11):e3740.
doi: 10.1371/journal.pone.0003740. Epub 2008 Nov 17.

Integrative microRNA and proteomic approaches identify novel osteoarthritis genes and their collaborative metabolic and inflammatory networks

Affiliations

Integrative microRNA and proteomic approaches identify novel osteoarthritis genes and their collaborative metabolic and inflammatory networks

Dimitrios Iliopoulos et al. PLoS One. 2008.

Abstract

Background: Osteoarthritis is a multifactorial disease characterized by destruction of the articular cartilage due to genetic, mechanical and environmental components affecting more than 100 million individuals all over the world. Despite the high prevalence of the disease, the absence of large-scale molecular studies limits our ability to understand the molecular pathobiology of osteoathritis and identify targets for drug development.

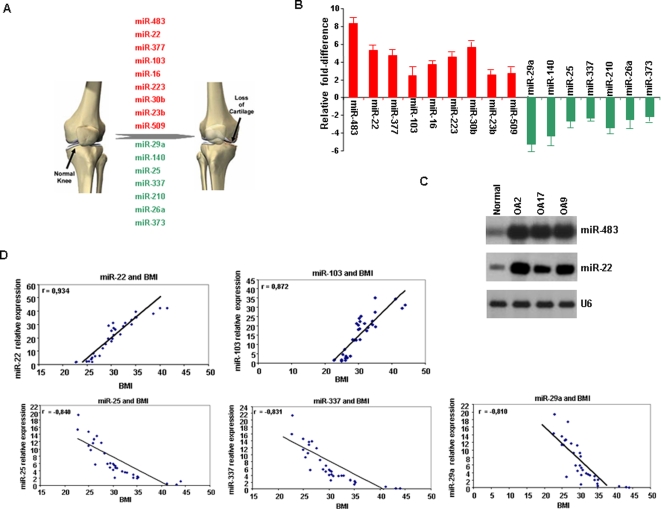
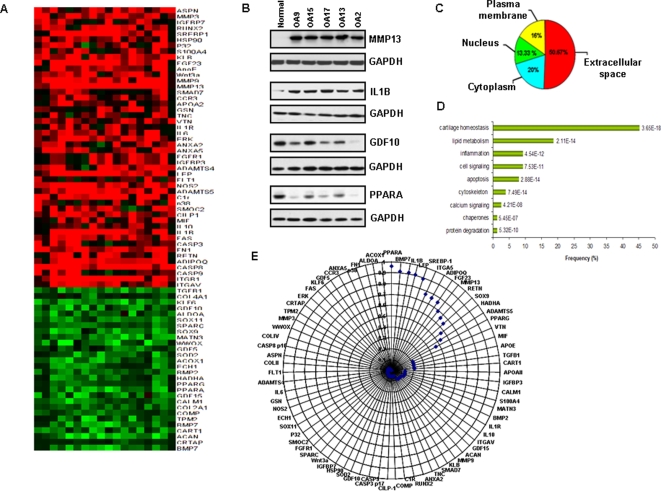
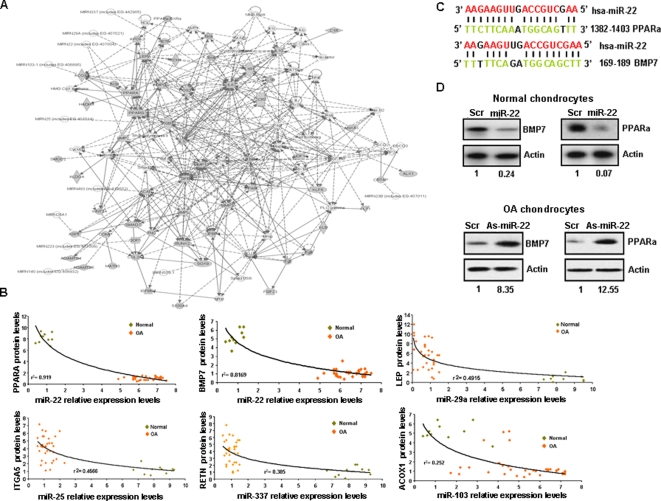
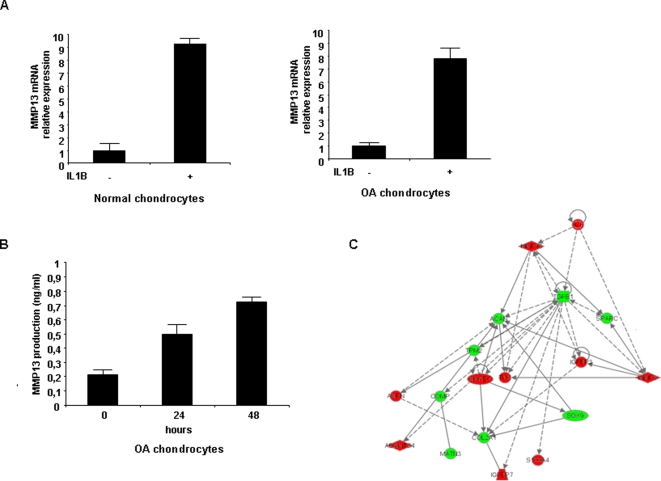
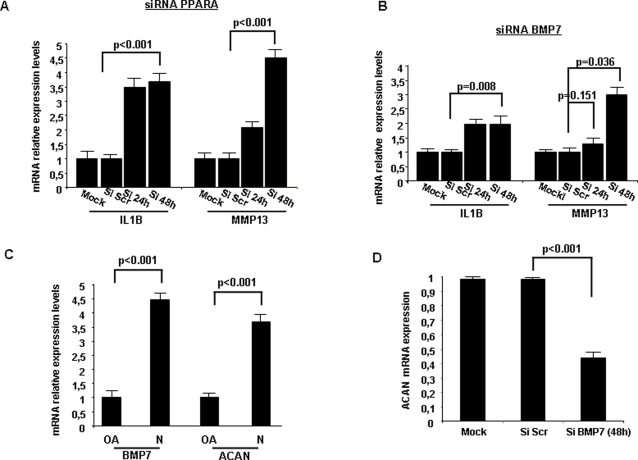
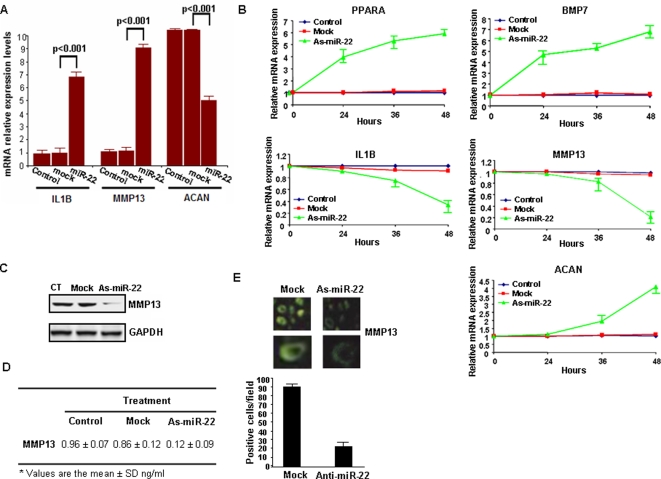
Methodology/principal findings: In this study we integrated genetic, bioinformatic and proteomic approaches in order to identify new genes and their collaborative networks involved in osteoarthritis pathogenesis. MicroRNA profiling of patient-derived osteoarthritic cartilage in comparison to normal cartilage, revealed a 16 microRNA osteoarthritis gene signature. Using reverse-phase protein arrays in the same tissues we detected 76 differentially expressed proteins between osteoarthritic and normal chondrocytes. Proteins such as SOX11, FGF23, KLF6, WWOX and GDF15 not implicated previously in the genesis of osteoarthritis were identified. Integration of microRNA and proteomic data with microRNA gene-target prediction algorithms, generated a potential "interactome" network consisting of 11 microRNAs and 58 proteins linked by 414 potential functional associations. Comparison of the molecular and clinical data, revealed specific microRNAs (miR-22, miR-103) and proteins (PPARA, BMP7, IL1B) to be highly correlated with Body Mass Index (BMI). Experimental validation revealed that miR-22 regulated PPARA and BMP7 expression and its inhibition blocked inflammatory and catabolic changes in osteoarthritic chondrocytes.

Conclusions/significance: Our findings indicate that obesity and inflammation are related to osteoarthritis, a metabolic disease affected by microRNA deregulation. Gene network approaches provide new insights for elucidating the complexity of diseases such as osteoarthritis. The integration of microRNA, proteomic and clinical data provides a detailed picture of how a network state is correlated with disease and furthermore leads to the development of new treatments. This strategy will help to improve the understanding of the pathogenesis of multifactorial diseases such as osteoarthritis and provide possible novel therapeutic targets.


Conflict of interest statement

Competing Interests: The authors have declared that no competing interests exist.

Figures

Figure 1
Figure 1. MicroRNA gene signature in osteoarthritis and correlation with clinicopathological parameters.
(A) Up-regulated (red color) and down-regulated (green color) microRNAs in 33 osteoarthritic and 10 normal cartilage samples assayed by TaqMan microRNAs assays. Included microRNAs were more than 2-fold deregulated. (B) Validation of previous results using Real-time SYBR Green microRNA detection assay. (C) Northern blot validation of microRNA microarray data. Representative examples of miR-483 and miR-22 expression in normal and osteoarthritic cartilage tissues (OA2, OA17, OA9). (D) MicroRNAs correlated with BMI (Body Mass Index) analyzed by SSPS version 12.0 statistical program.
Figure 2
Figure 2. Reverse phase protein arrays in osteoarthritic and normal cartilage tissues.
(A) Differentially expressed proteins between osteoarthritic and normal chondrocytes. Up-regulated are shown with red color, while down-regulated with green color. (B) Representative western blot analysis in protein extracts from five osteoarthritic tissues in comparison with normal cartilage. (C) Sub-cellular localization of differentially expressed proteins. (D) Functional clustering analysis of differentially expressed proteins (using DAVID NIH Bioinformatic Database). (E) Correlation coefficient wheel between protein expression levels of differentially expressed proteins in osteoarthritic vs normal chondrocytes and body mass index (BMI). We identified 3 protein groups, which showed statistically significant correlations between protein expression and BMI, according to the coefficient correlation index (r2). More specifically, the first group with the highest correlation (r2>0.900) consisted of PPARA, BMP7, IL1B, LEP (leptin) and SREBP1 proteins. The second group (0.600>r2>0.900) consisted of ITGA5, ADIPOQ (adiponectin), FGF23, MMP13, RETN (resistin) and SOX9. The third group (0.400>r2>0.600) consisted of 3 proteins (HADHA, ADAMTS5, PPARG) which had low degree of correlation with BMI. The rest of the proteins were not correlated with BMI.
Figure 3
Figure 3. Interactome network in osteoarthritis.
(A) Construction of an interactome network (p = 10-49) by integrating microRNA and proteomic data using Ingenuity Pathway Analysis (IPA) (more information in suppl. methods). The p value indicates the likelihood of focus genes to belong to a network versus those obtained by chance. Around half of the microRNAs (mir-337, miR-29a, miR-22, miR-103-1, miR-25) regulate genes involved in the metabolic pathways. (B) Correlation coefficients between microRNA expression levels and their gene targets protein levels in osteoarthritic and normal chondrocytes. (C) Predicted duplex formation between PPARA and BMP7 3′UTR with miR-22. (D) BMP7 and PPARA protein levels after miR-22 or inhibitor of miR-22 (as-miR-22) treatment (50 nM) for 48 h in normal and osteoarthritic chondrocytes, respectively.
Figure 4
Figure 4. IL1B regulates important components of cartilage homeostasis network.
(A) Treatment with IL1B (10 ng/ml) induces MMP-13 mRNA levels assessed by Real-time PCR analysis in normal and osteoarthritic chondrocytes. (B) ELISA assay detecting MMP-13 levels after IL-1b treatment of osteoarthritic chondrocytes. (C) Pertubation of IL1B affects important gene network components in normal chondrocytes. Treatment of normal chondrocytes with IL1B (10ng/ml) for 48 h affects the protein expression of cartilage structure related genes (red color shows up-regulation while green color down-regulation of protein expression). This experiment was performed in quadruplicate. Specifically there is activation of metalloproteinases 3 and 13 (MMP3, MMP13) and aggrecanases (ADAMTS4, ADAMTS5) leading to down-regulation of the cartilage structural proteins (ACAN, SPARC, COMP, TPM2, MATN3, COL2A1). In addition asporin (ASPN) is up-regulated which has been shown to inhibit TGF-beta and aggrecan synthesis (look ref 11). Furthermore SOX9, an important trascription factor implicated in chondrogenesis is highly down-regulated.
Figure 5
Figure 5. PPARA and BMP7 signaling pathways in chondrocytes.
(A) Assessment of IL1B and MMP13 mRNA levels after down-regulation of PPARA, 24 and 48 h after siRNA liposomal treatment into chondrocytes. (B) IL1B and MMP13 expression 24 and 48 h after BMP7 siRNA treatment. (C) Evaluation and correlation of BMP7 and ACAN (aggrecan) mRNA levels in normal and osteoarthritic chondrocytes assessed by real-time PCR analysis. (D) Aggrecan expression levels 48 h after BMP7 inhibition of expression using siRNA transferred by liposomes into normal chondrocytes. All experiments have been performed in triplicate.
Figure 6
Figure 6. miR-22 regulates PPARA and BMP7 signaling pathways in human chondrocytes.
(A) Evaluation by real-time PCR analysis of IL1B, MMP13 and ACAN mRNA expression levels 48 h after miR-22 (50 nM) liposomal transfection in normal chondrocytes. Real-time PCR analysis has been performed in triplicate. (B) Assessment of IL1B, MMP13 and ACAN mRNA levels after antisense-miR-22 transfection in osteoarthritic chondrocytes. As-miR-22 treatment affects very early (24 h) PPARA and BMP7 mRNA expression, while IL1B, MMP13 and ACAN expression is affected later (36–48 h) suggesting that there are secondary effects. Real-time PCR analysis has been performed in triplicate. (C, D) Western blot analysis and ELISA assay for MMP13 expression after as-miR-22 overexpression. In ELISA assay each sample has been loaded in quadruplicate and the assay has been performed in triplicate (average and standard deviation is shown). (E) MMP13 expression evaluated by immunofluorescence analysis of osteoarthritic chondrocytes after as-miR-22 liposomal transfection. In the bar graph is shown the average of MMP-13 expressing (green fluorescent) cells detected in 20 different fields in the microscope.

References

    1. Spector TD, MacGregor AJ. Risk factors for osteoarthritis: genetics. Osteoarthritis Cartilage. 2004;12:39–44. - PubMed
    1. Lawrence RC, Felson DT, Helmick CG, Arnold LM, Choi H, et al. Estimates of the prevalence of arthritis and other rheumatic conditions in the United States Part II. Arthritis Rheum. 2008;58:26–35. - PMC - PubMed
    1. Miyamoto Y, Mabuchi A, Shi D, Kubo T, Takatori Y, et al. A functional polymorphism in the 5′ UTR of GDF5 is associated with susceptibility to osteoarthritis. Nat Genet. 2007;39:529–33. - PubMed
    1. Kizawa H, Kou I, Iida A, Sudo A, Miyamoto Y, et al. An aspartic acid repeat polymorphism in asporin inhibits chondrogenesis and increases susceptibility to osteoarthritis. Nat Genet. 2005;37:138–44. - PubMed
    1. Lohmander LS, Gerhardsson M, Rollof J, Nilsson PM, Engström G. Incidence of severe knee and hip osteoarthritis in relation to different measures of body mass A population-based prospective cohort study. Ann Rheum Dis. 2008;8 [Epub ahead of print] - PubMed

Publication types

MeSH terms