. 2008 Nov 28;135(5):852-64.
doi: 10.1016/j.cell.2008.09.061. Epub 2008 Nov 13.

An oncogenomics-based in vivo RNAi screen identifies tumor suppressors in liver cancer

Affiliations

An oncogenomics-based in vivo RNAi screen identifies tumor suppressors in liver cancer

Lars Zender et al. Cell. .

Abstract

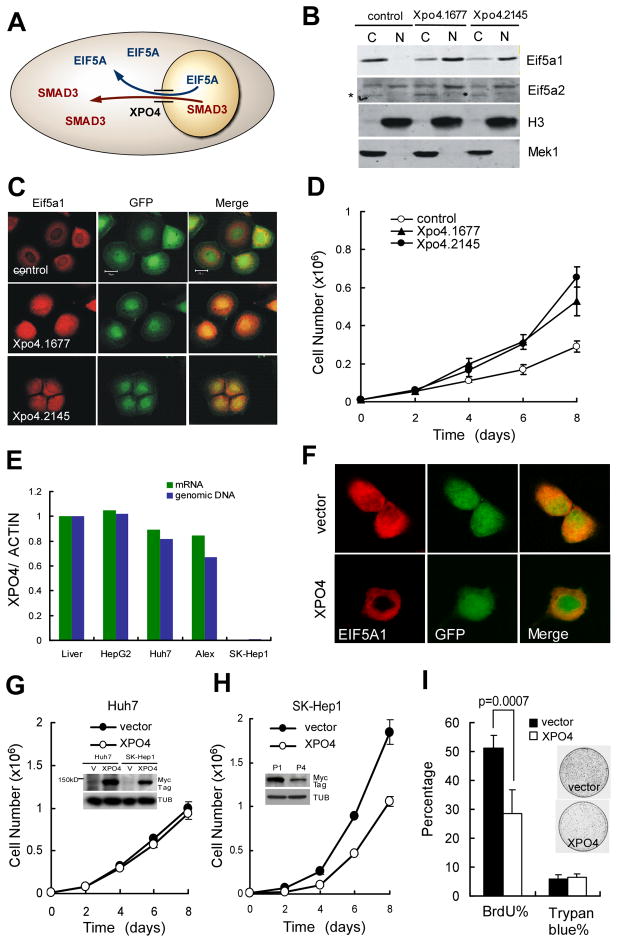
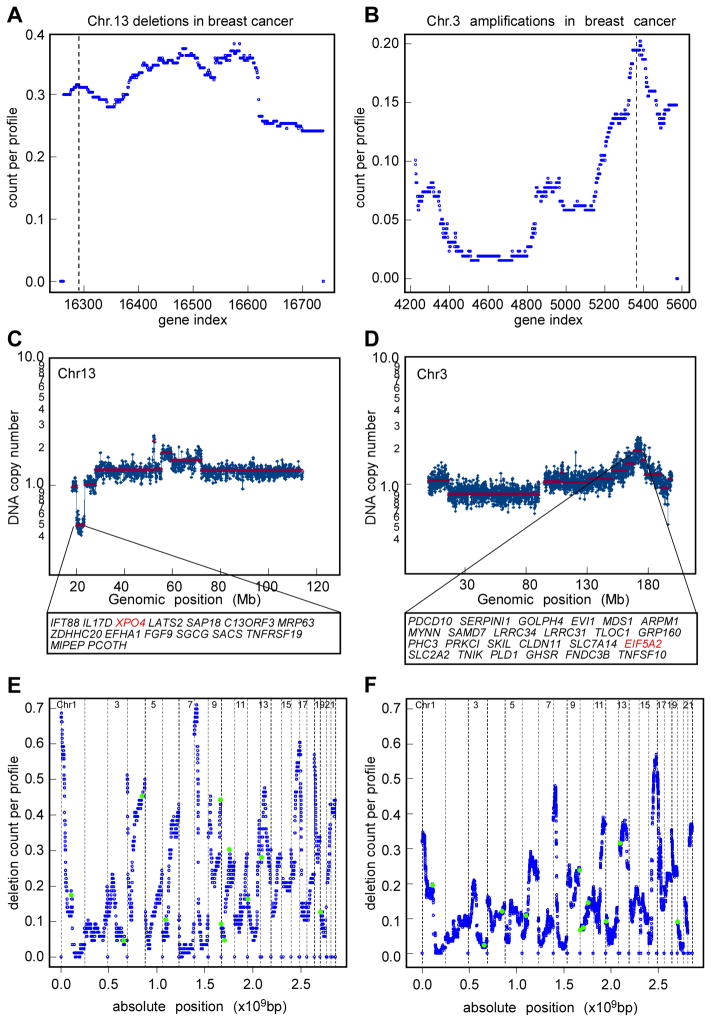
Cancers are highly heterogeneous and contain many passenger and driver mutations. To functionally identify tumor suppressor genes relevant to human cancer, we compiled pools of short hairpin RNAs (shRNAs) targeting the mouse orthologs of genes recurrently deleted in a series of human hepatocellular carcinomas and tested their ability to promote tumorigenesis in a mosaic mouse model. In contrast to randomly selected shRNA pools, many deletion-specific pools accelerated hepatocarcinogenesis in mice. Through further analysis, we identified and validated 13 tumor suppressor genes, 12 of which had not been linked to cancer before. One gene, XPO4, encodes a nuclear export protein whose substrate, EIF5A2, is amplified in human tumors, is required for proliferation of XPO4-deficient tumor cells, and promotes hepatocellular carcinoma in mice. Our results establish the feasibility of in vivo RNAi screens and illustrate how combining cancer genomics, RNA interference, and mosaic mouse models can facilitate the functional annotation of the cancer genome.


Figures

Figure 1
Figure 1. ROMA deletion based RNA interference library
(A) A representative whole genome ROMA array CGH plot of a human hepatocellular carcinoma (HCC). Arrow denotes the focal deletion highlighted in (C). (B) Deletion counts in ROMA profiles of 98 human HCC. The points in the vicinity of 58 focal deletions (containing 362 genes) are highlighted by red circles. Dashed lines denote chromosome boundaries. (C) A representative 524Kb focal deletion on chromosome 12 contains 10 genes.
Figure 2
Figure 2. Setup of in vivo RNA interference screening
(A) Schematic representation of the approach. ED=18 p53−/− liver progenitor cells are immortalized by transduction with a Myc expressing retrovirus. Subsequently, the cells are infected with single shRNAs or shRNA library pools and injected into the liver or subcutaneously to allow tumor formation. (B) Growth curve of tumors derived from p53−/−;Myc cells infected with a control shRNA or three Apc shRNAs. Values are average of 6 tumors. The inset shows knockdown of Apc protein assayed by western blot. (C) Bioluminescence imaging of tumors derived from p53−/−;Myc cells infected with a control shRNA or Apc shRNA and transplanted into the livers of immunocompromised recipient mice (n=4). Animals were imaged 40 days post surgery. (D) H&E and β-catenin staining of liver tumors in (C). Normal liver served as control. (E) Tumor growth curve of p53−/−;Myc cells infected with control shRNA (control), Apc shRNA (shAPC), a 1:50 diluted Apc shRNA (shAPC 1:50), Axin shRNA and a shRNA library pool (pool A7EH, taken from the Cancer1000 library).
Figure 3
Figure 3. In vivo shRNA library screening identifies PTEN as a potent tumor suppressor in HCC
(A) Average volume (n=8) of tumors derived from p53−/−;Myc cells infected with a control shRNA (control) and 10 random genome-wide shRNA pools (pool size n=48). (B) Average volume (n=8) of tumors derived from p53−/−;Myc cells infected with a control shRNA (control) and 13 ROMA deletion shRNA pools (pool size n=48). Red asterisks indicate tumors/shRNA pools subjected to subcloning and sequencing as shown in (C). (C) Representation of the strategy to recover shRNAs from tumor genomic DNA by PCR and subcloning of the PCR products into the vector used for hairpin validation. (D) Enrichment of two Pten shRNAs in selected tumors (right) compared to their representation in pre-injection plasmid pools (left). Pie graphs show the representation of each Pten shRNA in the total shRNA population analyzed by high-throughput sequencing. (E) ROMA arrayCGH plot showing a focal PTEN genomic deletion in a human HCC. (F) Validation of the same Pten shRNAs using orthotopically transplanted P53−/−;Myc cells transduced with the Pten shRNAs. Representative imaging results from 3 mice in each group are shown. (G) shRNA mediated knockdown of Pten increases phospho-Akt. Protein lysates from p53−/−;Myc liver cells infected with Pten shRNAs (Cell) or the derived tumors (Tumor) were immunoblotted with the indicated antibodies. Tubulin served as a loading control.
Figure 4
Figure 4. Novel tumor suppressor genes identified by in vivo RNAi screening
(A) Representation of some scoring shRNAs in the tumors. The representation of each shRNA is ~2% in the pre-injection plasmid pools, as shown in Figure 3D. (B) ROMA array CGH plots depicting focal genomic deletions of the genes in panel (A). (C) Validation of the top scoring shRNAs in a subcutaneous tumor growth assay as described in Figure 3F (n=4). Red asterisks depict genes that were further analyzed in (D). (D) In situ validation of at least three independent shRNAs targeting genes as depicted in panel (C). Black asterisks indicate CODEX shRNAs which were initially identified in the screen. Representative bioluminescence imaging results from 3 mice are shown.
Figure 5
Figure 5. Reintroduction of XPO4 selectively suppresses tumors with XPO4 deletion
(A) Schematic representation of XPO4 mediated nuclear export of SMAD3 and EIF5A. (B) Eif5a1 and Eif5a2 western blot of cytoplasmic (C) and nuclear (N) fractions of murine HCC cells infected with a control shRNA and two Xpo4 shRNAs. Histone 3 (H3) was used as loading control for the nuclear fraction and Mek1 for the cytoplasmic fraction. * denotes a non-specific band. (C) Eif5a1 immunofluorescence in murine HCC cells infected with Xpo4 shRNAs. (D) Xpo4 shRNAs promote cell proliferation in p53−/−;Myc liver cells. Error bars denote S.D. (n=2). (E) Expression profile of XPO4 in human hepatoma cell lines. mRNA abundance and genomic DNA copy numbers of XPO4 were measured by RT-Q-PCR and genomic Q-PCR. Assays were normalized to actin and to the RNA and DNA from normal liver. (F) Nuclear accumulation of EIF5A1 in XPO4 deficient cells is reverted by reintroduction of XPO4 cDNA. EIF5A1 immunofluorescence of human HCC cell line SK-Hep1 (XPO4 deleted) infected with control vector or XPO4 cDNA. (G-H) Reintroduction of XPO4 cDNA into XPO4 deficient cells inhibits cell proliferation. Cell growth curves of XPO4 postive (Huh7, panel G) and XPO4 negative (SK-Hep1, panel H) human hepatoma cells infected with control vector or XPO4 cDNA. Error bars denote S.D. (n=2). Inlay in (G) indicate expression level of the 6xMyc tagged XPO4 cDNA at early passage in both cell lines. Inlay in (H) indicate XPO4 expression in passage 1 (P1) and passage 4 (P4) SK-Hep1 cells post retroviral infection and puromycin selection. (I) Percentage of BrdU+ (proliferating) and Trypan blue+ (apoptotic) cells in SK-Hep1 cells infected with vector control or Xpo4 cDNA. Error bars denote S.D. (n=5). Inlay shows colony formation assay of SK-Hep1 cells infected with Xpo4 cDNA.
Figure 6
Figure 6. EIF5A2 is a key downstream effector of XPO4 in tumor suppression
(A) ROMA array CGH plot of a human HCC showing an EIF5A2 containing amplicon on chromosome 3. (B) EIF5A2 expression promotes tumor formation in P53−/−;Myc liver progenitor cells. Subcutaneous tumor growth assays were performed as in Figure 2B. Error bars denote S.D. (n=4). (C) Knockdown of EIF5A2 attenuates proliferation of human hepatoma cells harboring XPO4 deletion. Cell numbers were measured by MTT assay in human hepatoma cell lines Huh7 (wild type), Alex (EIF5A2 amplicon) and SK-Hep1 (XPO4 deletion) 48 hrs post siRNA transfection. Error bars denote S.D. (n=3). (D) Colony formation assay of SK-Hep1 cells transfected with indicated single siRNA or combination.
Figure 7
Figure 7. Frequent copy number alterations of XPO4 and EIF5A2 in human breast cancer
(A) XPO4 is frequently deleted in human breast cancer. Shown are the deletion counts in ROMA profiles of 257 human breast cancers with the genes sorted by their genomic transcription start position. Blue dots represent the deletion frequency counts for each gene on chromosome 13. The dashed line points to XPO4. (B) EIF5A2 is frequently amplified in human breast cancer. Amplification counts (as described in A) of chromosome 3 in human breast cancer. The dashed line points to EIF5A2. (C) ROMA plot of a 3.3Mb XPO4 deletion in a human breast cancer cell line. (D) ROMA plot of a 5.8Mb spanning EIF5A2 amplicon in a human breast carcinoma. (E) Genomic distribution of scoring genes from the in vivo RNAi screen. Blue dots denote the deletion frequency count (98 human HCC) for each gene in the genome. Green dots depict the 13 scoring genes (embedded in 11 focal deletions) from the HCC RNAi screen. Dashed lines represent chromosome boundaries. Note: ARMCX1/2 on the X chromosome, are not included. (F) Tumor suppressor genes identified through the HCC in vivo RNAi screen are also frequently deleted in human breast cancer. Green circles depict the newly identified tumor suppressor genes in a deletion count frequency plot of 257 human breast cancers.

Comment in

References

    1. Benne R, Hershey JW. The mechanism of action of protein synthesis initiation factors from rabbit reticulocytes. J Biol Chem. 1978;253:3078–3087. - PubMed
    1. Caraglia M, Marra M, Giuberti G, D'Alessandro AM, Budillon A, Del Prete S, Lentini A, Beninati S, Abbruzzese A. The role of eukaryotic initiation factor 5A in the control of cell proliferation and apoptosis. Amino Acids. 2001;20:91–104. - PubMed
    1. Chin L, Gray JW. Translating insights from the cancer genome into clinical practice. Nature. 2008;452:553–563. - PMC - PubMed
    1. Chow LM, Baker SJ. PTEN function in normal and neoplastic growth. Cancer Lett. 2006;241:184–196. - PubMed
    1. Clement PM, Henderson CA, Jenkins ZA, Smit-McBride Z, Wolff EC, Hershey JW, Park MH, Johansson HE. Identification and characterization of eukaryotic initiation factor 5A-2. Eur J Biochem. 2003;270:4254–4263. - PubMed

Publication types