. 2008 Nov 25;18(22):1792-6.
doi: 10.1016/j.cub.2008.09.062. Epub 2008 Nov 13.

Cockroaches keep predators guessing by using preferred escape trajectories

Affiliations

Cockroaches keep predators guessing by using preferred escape trajectories

Paolo Domenici et al. Curr Biol. .

Abstract

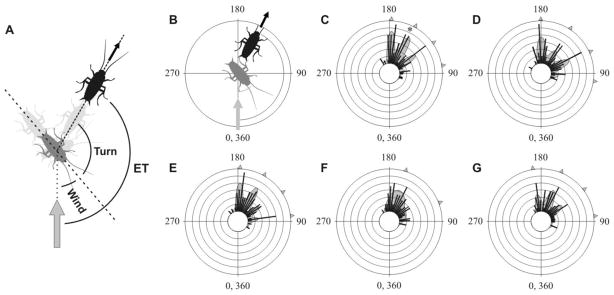
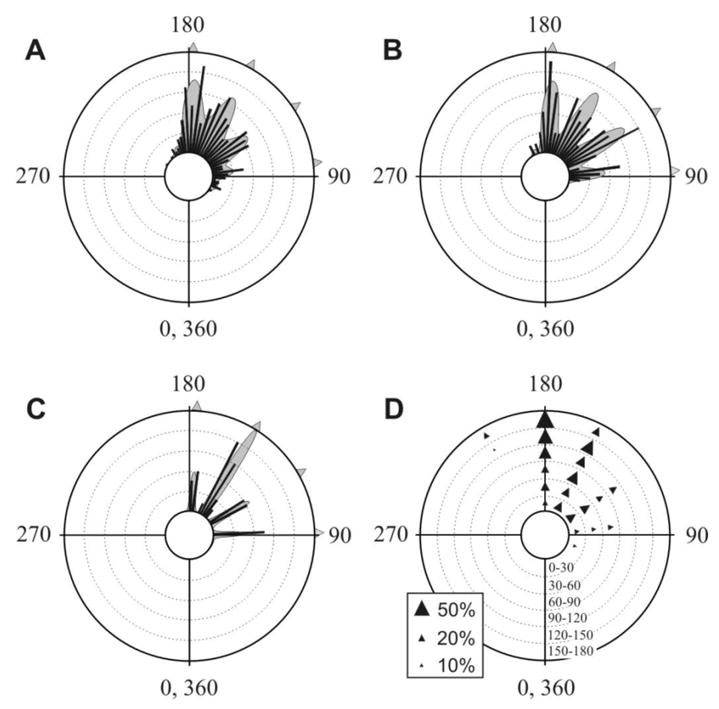
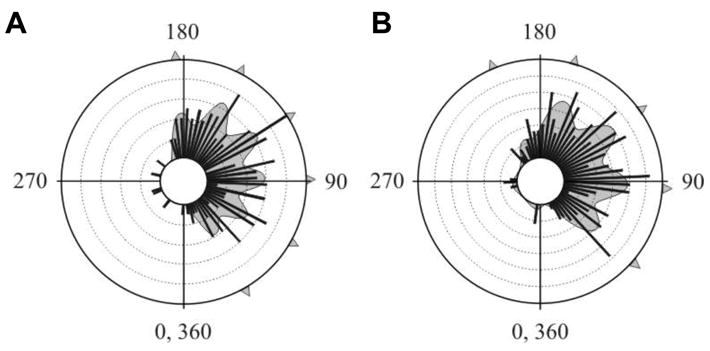
Antipredator behavior is vital for most animals and calls for accurate timing and swift motion. Whereas fast reaction times [1] and predictable, context-dependent escape-initiation distances [2] are common features of most escape systems, previous work has highlighted the need for unpredictability in escape directions, in order to prevent predators from learning a repeated, fixed pattern [3-5]. Ultimate unpredictability would result from random escape trajectories. Although this strategy would deny any predictive power to the predator, it would also result in some escape trajectories toward the threat. Previous work has shown that escape trajectories are in fact generally directed away from the threat, although with a high variability [5-8]. However, the rules governing this variability are largely unknown. Here, we demonstrate that individual cockroaches (Periplaneta americana, a much-studied model prey species [9-14]) keep each escape unpredictable by running along one of a set of preferred trajectories at fixed angles from the direction of the threatening stimulus. These results provide a new paradigm for understanding the behavioral strategies for escape responses, underscoring the need to revisit the neural mechanisms controlling escape directions in the cockroach and similar animal models, and the evolutionary forces driving unpredictable, or "protean"[3], antipredator behavior.


Figures

Fig. 1
Fig. 1. Individual cockroaches tested in repeated trials show similar, striking multimodal distributions of ETs
(A) Diagram of the sequence of movements in a typical cockroach escape response. The cockroach is walking from the left to the right of the picture. Grey arrow indicates stimulus direction. Wind angle (wind) at the time of stimulation, body turn (turn) and escape trajectory (ET) are shown. (B) Diagram illustrating the definition of escape trajectory (ET) and the way it is plotted in all subsequent figures. Escape trajectory (continuous arc) is defined as the angle between wind direction (grey arrow) and the direction of motion (black arrow) of the escaping cockroach (black cockroach). Left and right stimuli were pooled as if each stimulus was always on the right side of the animal. C, D, E, F, G show the frequency distributions of five individual cockroaches tested in repeated trials. Numbers of responses are 93 (C), 93 (D), 89 (E), 81 (F), 75 (G). The asterisk in C represents the trajectory of the escape response drawn in B. Best- fit distributions in C, D, E, F, G are shown as multimodal curves. The statistics for the fitted curves are (C): Akaike weight = 0.91, χ2 =14.77, P=0.254, d.f. = 12; (D): Akaike weight = 0.93, χ2 =19.87, P=0.099, d.f.=13; (E): Akaike weight = 0.85, χ2 =8.98, P=0.623, d.f.=11; (F): Akaike weight = 0.51, χ2 =10.48, P=0.399, d.f. = 10; (G): Akaike weight = 0.67, χ2 =4.76, P=0.854, d.f.=9. For all panels, concentric circles represent a frequency interval of 2, bin intervals are 5°, arrowheads indicate peaks, defined as those that contribute at least 5% to the best- fit curve.
Fig. 2
Fig. 2. The ET distribution of 5 individuals tested in repeated trials and 86 singletons tested each once only are not significantly different from each other
(A) Frequency histograms of data set 5i (pooling 5 individuals from Fig. 1). Total number of responses = 431, concentric circles represent a frequency of 10. Bin intervals are 5°. The best- fit curve Akaike weight >0.99, χ2 =23.71, P=0.536, d.f.=25. (B) Frequency histograms of singletons. Total number of responses = 86, concentric circles represent a frequency of 2. Bin interva ls are 5°. The best- fit curve Akaike weight = 0.74, χ2 =5.48, P=0.906, d.f. = 11. (C) The distribution of wind angles in escape responses (data-set 5i) that showed little or no body turns (0–10°; number of responses =38). Concentric circles represent a frequency of 2. Bin intervals are 5°. The wind angles show 4 peaks as in the preferred ETs found in A and B; see text for details. The best- fit curve Akaike weight = 0.83, χ2 = 0.38, P=0.943, d.f.=3. For all panels, best- fit distributions are shown as multimodal curves and arrowheads indicate peaks, defined as those that contribute at least 5% to the best fit curve. (D) The effect of wind direction on ETs. Diagrammatic representation of the effect of wind angle on ET probability for the five individuals (data set 5i). Stimulus wind angle is indicated by the radial scale. The different ET peaks determined above for the 5i data are indicated by arrowheads at the appropriate angular positions, with the width of the arrowhead indicating the percentage contribution of that particular peak to the ET distribution at that particular wind angle. For scale, arrowheads are shown corresponding to 10%, 20% and 50% contributions (inset). Peaks with a contribution of less than 5% are not shown. As wind angles increase, the lower value ET peaks disappear and a larger 204° peak appears.
Fig. 3
Fig. 3. Re-analysis of cockroach escape-behavio ur data from the published literature reveals hitherto undetected patterns of ET distributions
(A) Concentric circles represent a frequency of 2. Bin intervals are 5°. Number of responses=161. Based on published data [6]. Akaike weight 0.68, χ2 = 13.06, P=0.907, d.f.=21. (B) Concentric circles represent a frequency of 2.5. Bin intervals are 5°. Number of responses=253. Based on published data [10]. Akaike weight 0.76, χ2 = 27.19, P=0.709, d.f.=32. For both panels, the best-fit distribution is shown as a multimodal curve and arrowheads indicate peaks, defined as those that contribute at least 5% to the best-fit curve.

Comment in

References

    1. Bullock TH. Comparative neuroethology of startle, rapid escape and giant fiber-mediated responses. In: Eaton RC, editor. Neural Mechanisms of Startle Behaviour. New York: Plenum Press; 1984. pp. 1–13.
    1. Ydenberg RC, Dill LM. The economics of fleeing from predators. Advances in the Study of Behaviour. 1986;16:229–249.
    1. Humphries DA, Driver PM. Protean defence by prey animals. Oecologia. 1970;5:285–302. - PubMed
    1. Driver PM, Humphries DA. Protean Behaviour: The Biology of Unpredictability. Oxford: Clarendon; 1988.
    1. Godin J-GJ. Evading predators. In: Godin J-GJ, editor. Behavioural Ecology of Teleost Fishes. Oxford: Oxford University Press; 1997. pp. 191–236.

Publication types

LinkOut - more resources