. 2009 Jan 1;325(1):211-24.
doi: 10.1016/j.ydbio.2008.10.025. Epub 2008 Oct 31.

The gastric epithelial progenitor cell niche and differentiation of the zymogenic (chief) cell lineage

Affiliations

The gastric epithelial progenitor cell niche and differentiation of the zymogenic (chief) cell lineage

Andrew J Bredemeyer et al. Dev Biol. .

Abstract

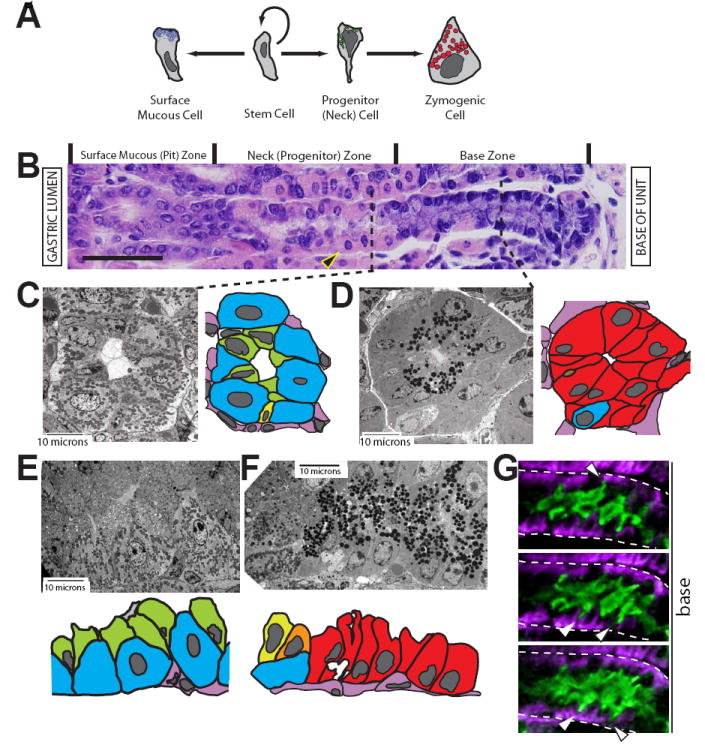
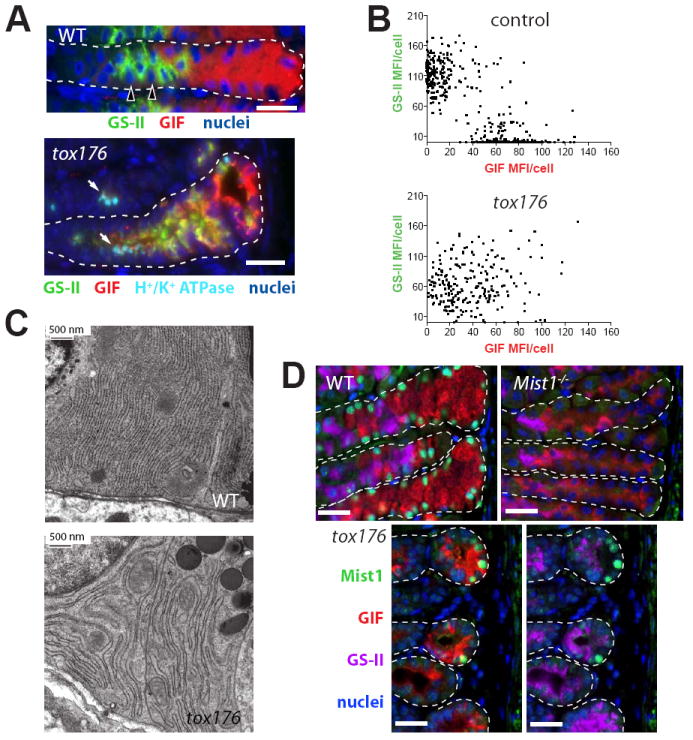
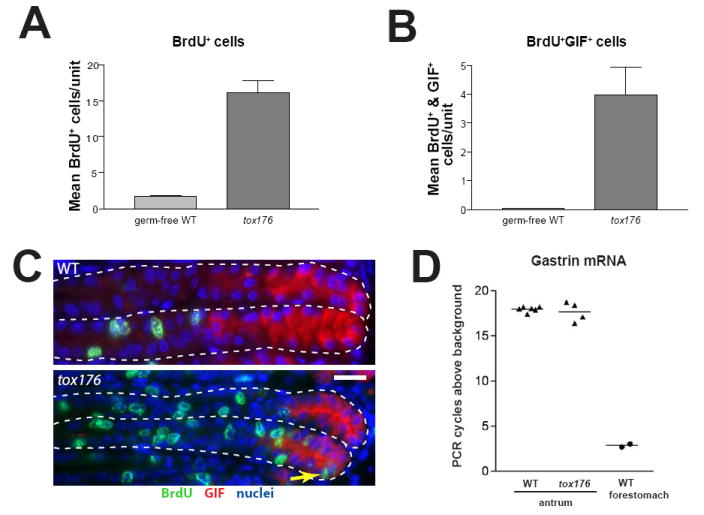
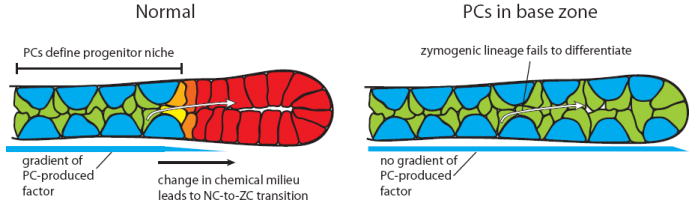
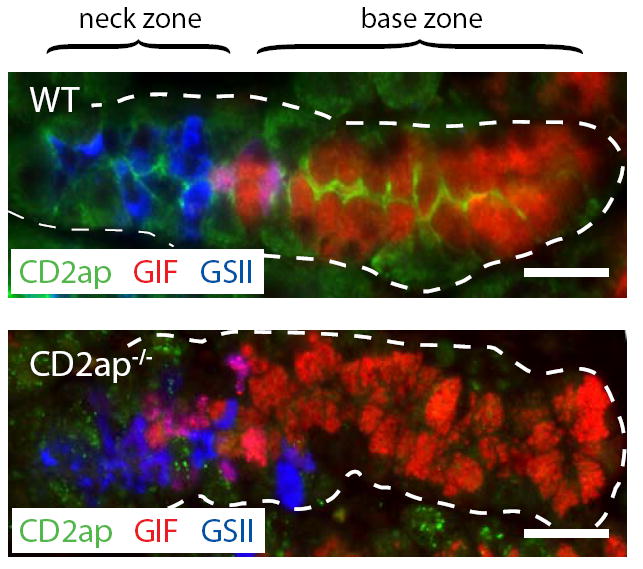
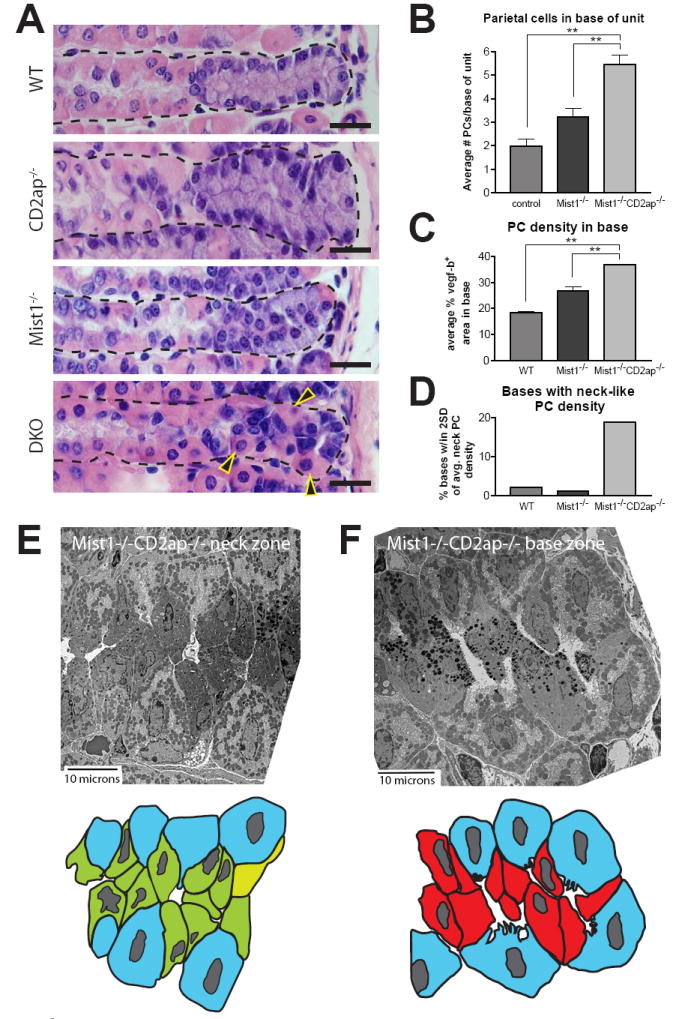
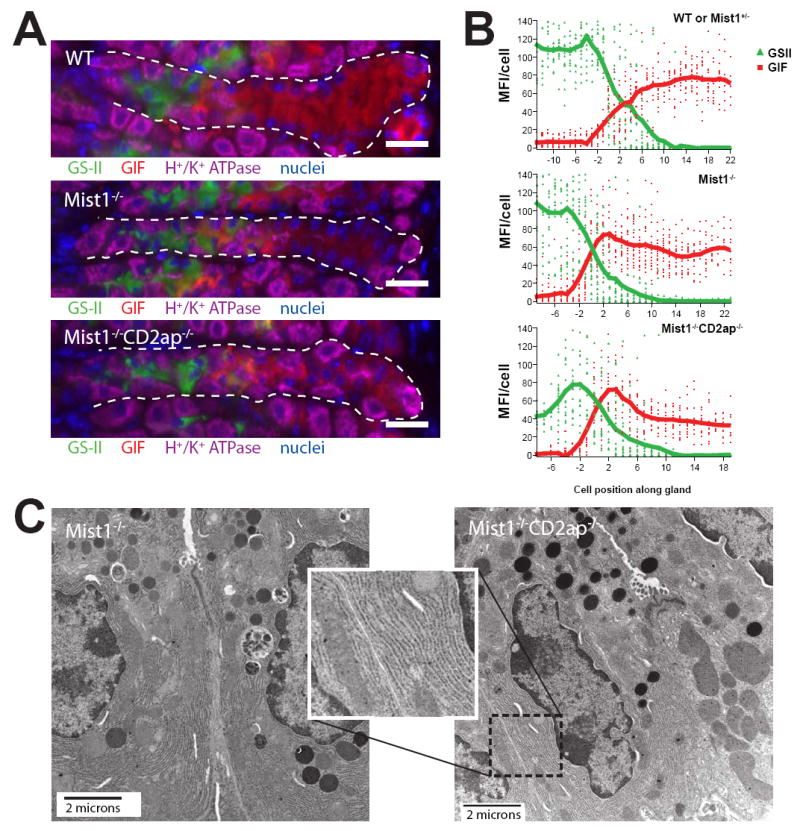
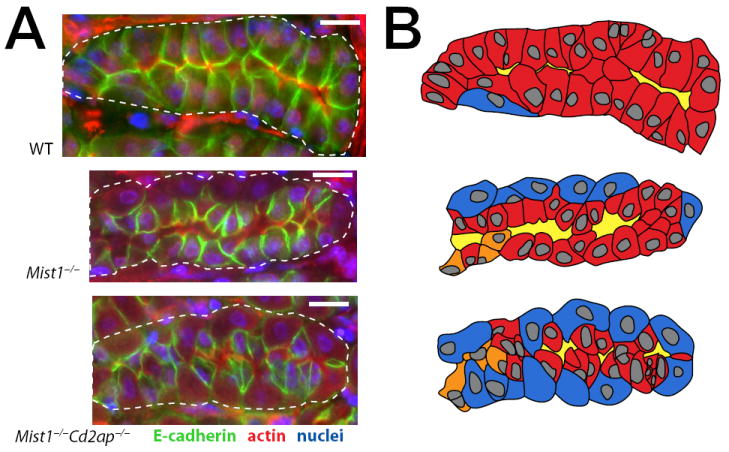
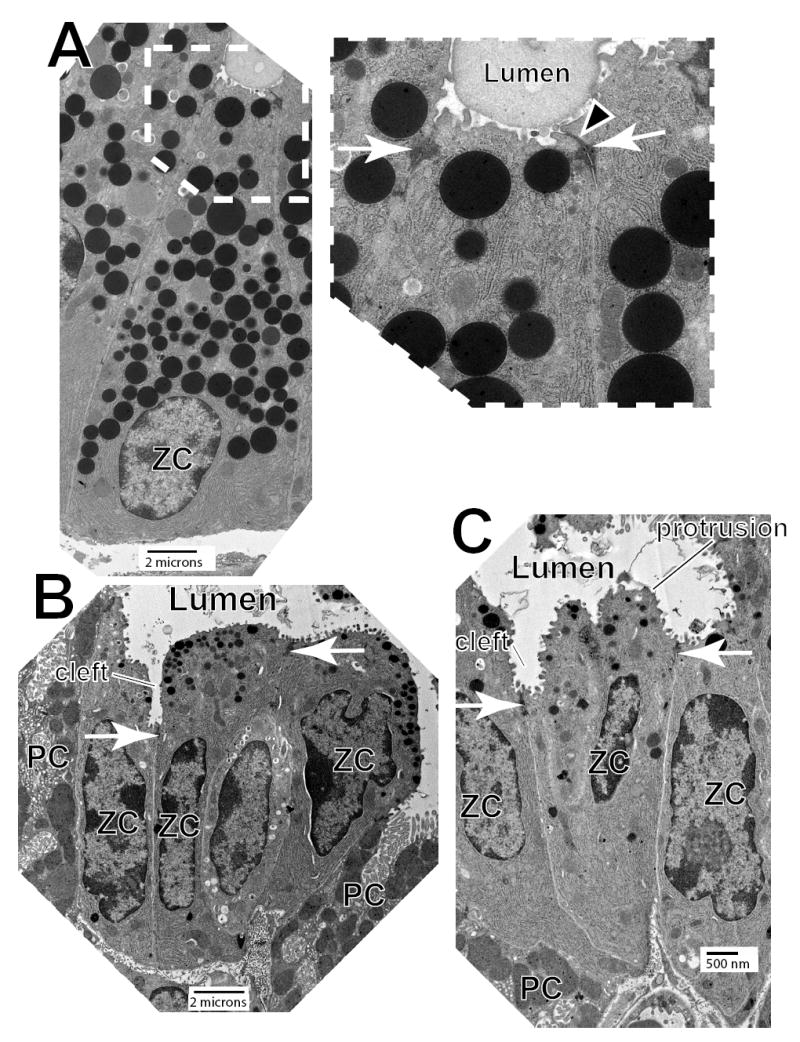
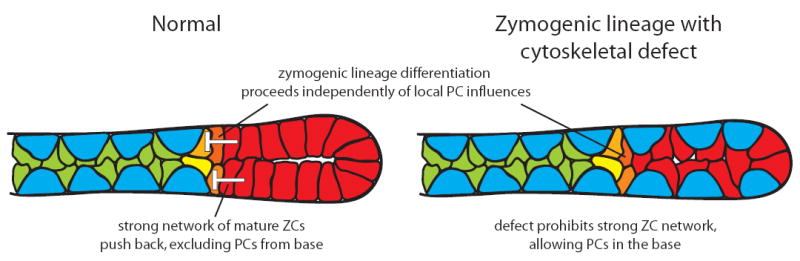
In the mammalian gastrointestinal tract, the cell fate decisions that specify the development of multiple, diverse lineages are governed in large part by interactions of stem and early lineage progenitor cells with their microenvironment, or niche. Here, we show that the gastric parietal cell (PC) is a key cellular component of the previously undescribed niche for the gastric epithelial neck cell, the progenitor of the digestive enzyme secreting zymogenic (chief) cell (ZC). Genetic ablation of PCs led to failed patterning of the entire zymogenic lineage: progenitors showed premature expression of differentiated cell markers, and fully differentiated ZCs failed to develop. We developed a separate mouse model in which PCs localized not only to the progenitor niche, but also ectopically to the gastric unit base, which is normally occupied by terminally differentiated ZCs. Surprisingly, these mislocalized PCs did not maintain adjacent zymogenic lineage cells in the progenitor state, demonstrating that PCs, though necessary, are not sufficient to define the progenitor niche. We induced this PC mislocalization by knocking out the cytoskeleton-regulating gene Cd2ap in Mist1(-/-) mice, which led to aberrant E-cadherin localization in ZCs, irregular ZC-ZC junctions, and disruption of the ZC monolayer by PCs. Thus, the characteristic histology of the gastric unit, with PCs in the middle and ZCs in the base, may depend on establishment of an ordered adherens junction network in ZCs as they migrate into the base.


Figures

Figure 1
Figure 1. Parietal cells are a key cellular component of the gastric epithelial progenitor niche
A, schematic of surface mucous and zymogenic lineage differentiation from a stem cell. The parietal and enteroendocrine lineages are not depicted. B, gastric unit stained with H&E. The unit opens out into the gastric lumen to the left; the lamina propria and muscle are to the right. Gastric unit zones are delineated above the image. The cells depicted in panel A are aligned with the zones in B in which they reside. The large eosinophilic (pink) cells are parietal cells (PCs, e.g., arrowhead). Scale bar = 50 μM. C-F, tEM images of gastric unit zones with accompanying cartoon traces of the EM image. PCs, blue; NCs, green; neck-to-zymogenic transitional (Ramsey et al., 2007), yellow/orange; ZCs, red; mesenchymal/endothelial cells, pink. C, cross section through the neck zone. Note how NCs (green) line the lumen apically but have scant basement membrane contact. D, cross section through the base zone. E-F, longitudinal sections through the progenitor (E) and base (F) zones. Note how the progression from NC to ZC involves not only a switch from electron lucent (mucous) to electron dense (zymogenic) granules but also substantial expansion of contact with the basement membrane. G, three serial slices from two-photon, 3-dimensional imaging of an entire gastric unit. The neck zone is shown, with NCs in green and PCs in purple. Note the thin NC projections (arrowheads) towards the basement membrane (dashed white line).
Figure 2
Figure 2. PCs are required for normal differentiation of both NCs and ZCs
A, wild-type (WT) and tox176 stomachs immunostained with the NC-specific lectin Griffonia simplicifolia II (GS-II, green); anti-gastric intrinsic factor (GIF), a marker for murine ZCs (red); anti-H+/K+ ATPase (PC-specific; teal), and bisbenzimide (blue). Note that most cells in the tox176 unit are positive for both neck and zymogenic cell markers. The small foci of teal stain in tox176 (arrows) are remnants of apoptotic PCs; the PC channel is not shown in WT mice, so NC-basement membrane interactions are more easily seen (arrowheads indicate two PC nuclei). Scale bar = 20 μM. B, scatter plots of quantified GS-II and GIF mean fluorescence intensity (MFI) of individual cells in control (top) and tox176 (bottom) stomachs. While data points cluster at the axes in control stomachs, tox176 data points yield a diffuse pattern and reveal a lower average MFI in both channels. C, tEM images of rER in WT ZCs (top) and abnormal zymogenic lineage base zone cells from a tox176 stomach. Note the less organized, more distended rER in the tox176 cells. D, Mist1 expression in the gastric unit bases of WT, Mist1−/−, and tox176 stomachs (most of the neck zone is not shown). Stomach sections were stained with anti-Mist1 (green), GS-II (purple), anti-GIF (red), and bisbenzimide (blue). While all GIF+ cells in WT gastric units stained with anti-Mist1, only occasional Mist1+ cells were seen at the very base of tox176 units (note this field was selected to illustrate units with Mist1+ cells, and therefore overrepresents Mist1+ cell frequency). In the tox176 units, GIF and GS-II staining channels are shown separately. The Mist1−/− stomach is shown as an antibody specificity control. Scale bars = 20 μM.
Figure 3
Figure 3. Cellular proliferation is increased in tox176 gastric units
A, quantification of mean (±SEM) bromodeoxyuridine (BrdU) positive cells per gastric unit in corpus (n=4 mice/genotype). B, quantification of mean (±SEM) BrdU and GIF double-positive cells per gastric unit. C, WT (top) and tox176 (bottom) gastric units immunostained with anti-BrdU (green); anti-GIF (red); and bisbenzimide (blue). The presence of BrdU+/GIF+ cells in the base of the tox176 gastric units (arrow) highlights the rapid turnover and altered differentiation pattern of the zymogenic lineage in the absence of PCs. Scale bar = 20μm. D, WT and tox176 Gastrin mRNA levels in whole antrum resections, measured by qRT-PCR. Each data point represents a single mouse. Shown is the number of PCR cycles required to detect the Gastrin amplicon in a given mouse subtracted from the number of cycles required for non-specific amplification with Gastrin primers. (See Methods) Therefore, higher numbers represent more abundant message. PCR products from forestomach mRNA, which contains negligible numbers of Gastrin producing cells, are identifiable only a few cycles above baseline. Gastrin messages in tox176 and WT mice are abundant but virtually equal.
Figure 4
Figure 4. Model for results expected when PCs expand out of the neck (progenitor) zone and into the base (differentiated) cell zone
It has been assumed that PCs establish a chemical gradient or work by cell-cell contact to control terminal differentiation of the zymogenic lineage (left). If PCs were to be extended into the base zone (right), zymogenic lineage cells would be unable to escape this gradient and would fail to differentiate.
Figure 5
Figure 5. Cd2ap protein expression increases as NCs transition into ZCs
Stomach sections were stained with anti-Cd2ap (green), GS-II (blue), and anti-GIF. Note the strong luminal expression of Cd2ap in ZCs. The Cd2ap−/− section is shown as an antibody specificity control. Scale bars = 20 μM.
Figure 6
Figure 6. In the Mist1−/− background, Cd2ap deficiency results in mislocalized PCs and disorganized base zones
A, H&E stained sections of the genotypes indicated. Note the abundance of PCs (arrowheads) and extreme disorganization in the base of the Mist1−/−Cd2ap−/− unit. Scale bars = 20 μM. B, quantification of base zone PCs. C, base zone PC density calculations (see Methods). Both measures of PC presence in the base show 2-3 times the PC density in Mist1−/−Cd2ap−/− vs. WT bases. D, the fraction of units with base PC density approaching the density seen in the neck zone. Quantification compiled from 4 Mist1−/−Cd2ap−/−, 3 Mist1−/−, and 3 WT mice. E, tEMs and cartoon traces of Mist1−/−Cd2ap−/− progenitor and base zones. Note the similarity in architecture between the two zones.
Figure 7
Figure 7. Despite continued PC contact, ZCs develop in Mist1−/−Cd2ap−/− stomachs
A, stomach sections immunostained with GS-II (green), anti-GIF (red), anti-H+/K+ ATPase (purple), and bisbenzimide (blue). Note that GS-II is shut off and GIF is turned on in the base zone of all genotypes, including Mist1−/−Cd2ap−/−. Scale bar = 20 μM. B, mean fluorescence values (GS-II, green; GIF, red) of individual cells along the length of ~15 glands (neck and base) from multiple mice were compiled to yield the trend lines shown (see Methods). Negative cell positions correspond to the neck zone; positive cell positions, to the base. C, tEM of Mist1−/− and Mist1−/−Cd2ap−/− ZCs. Note the abundant rER in cells of both genotypes and in the inset.
Figure 8
Figure 8. Loss of Cd2ap in Mist1−/− mice leads to irregular distribution of E-cadherin
A, WT, Mist1−/−, and Mist1−/−Cd2ap−/− gastric unit bases immunostained with E-cadherin (green), actin (red), anti-GIF (channel not shown in panel), and bisbenzimide (blue). Note in the WT base, E-cadherin reveals that ZCs form ordered, junctional complexes with other ZCs. E-cadherin staining is perpendicular to the membrane. Because the cells are the same height, the lumen is regular and parallel to the basement membrane. In the Mist1−/− base, E-cadherin junctions are still perpendicular to the membrane, and ZCs mostly form junctional complexes with other ZCs. ZCs are of relatively consistent height. E-cadherin immunostaining tends to be more intense, although the cells are shorter. The shorter cells define a broader caliber lumen. Note, that more PCs are also in the base relative to WT. In the Mist1−/−Cd2ap−/− base, E-cadherin immunostaining shows that ZCs form junctional complexes with other ZCs much less frequently, and E-cadherin is haphazardly arranged with respect to the basement membrane. Cell height is difficult to determine due to the lack of consistent orientation of E-cadherin staining with respect to the baement membrane. E-cadherin staining intensity tends to be less intense. Due to irregular cell-cell interactions, the lumen is tortuous. Scale bars=15 μm. B, For clarification of base architecture, cartoons of the units in A are depicted. The ZCs (red) were distinguished by GIF staining from PCs (blue) and NC-ZC transitional cells (orange). The lumen is marked in yellow.
Figure 9
Figure 9. Mislocalization of junctional complexes leads to markedly irregular lumens in Mist1−/−Cd2ap−/− mice
A, Transmission EM of a typical WT ZC at the very base of the gastric unit. Note that the cell has a pyramidal shape (typical of ZCs bending around the cul de sac of the unit). inset- higher magnification view of the apical lumen and junctional complexes. Tight (arrowhead) and adherens (arrows) junctions are near the apex of each ZC, and the luminal plasma membrane is smooth and regular. B,C Mist1−/−Cd2ap−/− ZCs have ultrastructurally normal adherens junctions (arrows), but the junctions are haphazardly localized with respect to the basement membrane. The apical plasma membrane is irregular, and its luminal surface is characterized by frequent protrusions between junctions and clefts at junctions. Note frequent parietal cells (“PC”) intercalating between ZCs and in between ZCs and the basement membrane.
Figure 10
Figure 10. “Push-back” model illlustrating why PCs mostly localize to the progenitor niche
left - In normal WT gastric units, as the mucus-secreting NCs (green) in the progenitor zone transition into mature, enzyme-secreting ZCs (red), they develop strong cytoskeletal networks and adhesions to neighboring ZCs, thus establishing planar polarity. This epithelial monolayer that ZCs thus form forcibly excludes PCs (ZC-derived force depicted by white t-bars in the figure). right - Our results have shown that disrupting cell-cell adhesions in ZCs leads to failure of ZCs to exclude PCs from the base; however, neither the increased proximity of PCs to ZCs nor the ZC cytoskeletal defects affect the downregulation of NC differentiation markers and upregulation of ZC differentiation markers. Thus, the timing or location of the transition from mucus secretion to digestive-enzyme secretion is not affected by the position of PCs. We conclude that PCs are normally located in the progenitor region of the gastric unit not to establish a distinct progenitor niche to direct NC-ZC differentiation (as modeled in Fig. 4); rather, PCs simply accumulate there because differentiated ZCs exclude them from the base.

Similar articles

Cited by

References

    1. Barker N, van Es JH, Kuipers J, Kujala P, van den Born M, Cozijnsen M, Haegebarth A, Korving J, Begthel H, Peters PJ, Clevers H. Identification of stem cells in small intestine and colon by marker gene Lgr5. Nature. 2007;449:1003–7. - PubMed
    1. Beauchamp RD, Barnard JA, McCutchen CM, Cherner JA, Coffey RJ., Jr Localization of transforming growth factor alpha and its receptor in gastric mucosal cells. Implications for a regulatory role in acid secretion and mucosal renewal. J Clin Invest. 1989;84:1017–23. - PMC - PubMed
    1. Bertet C, Sulak L, Lecuit T. Myosin-dependent junction remodelling controls planar cell intercalation and axis elongation. Nature. 2004;429:667–71. - PubMed
    1. Blostein R, Zhang R, Gottardi CJ, Caplan MJ. Functional properties of an H,K-ATPase/Na,K-ATPase chimera. J Biol Chem. 1993;268:10654–8. - PubMed
    1. Brown SL, Riehl TE, Walker MR, Geske MJ, Doherty JM, Stenson WF, Stappenbeck TS. Myd88-dependent positioning of Ptgs2-expressing stromal cells maintains colonic epithelial proliferation during injury. J Clin Invest. 2007;117:258–69. - PMC - PubMed

Publication types

MeSH terms

Substances