. 2008 Nov 14;135(4):726-37.
doi: 10.1016/j.cell.2008.09.037.

FLO1 is a variable green beard gene that drives biofilm-like cooperation in budding yeast

Affiliations

FLO1 is a variable green beard gene that drives biofilm-like cooperation in budding yeast

Scott Smukalla et al. Cell. .

Abstract

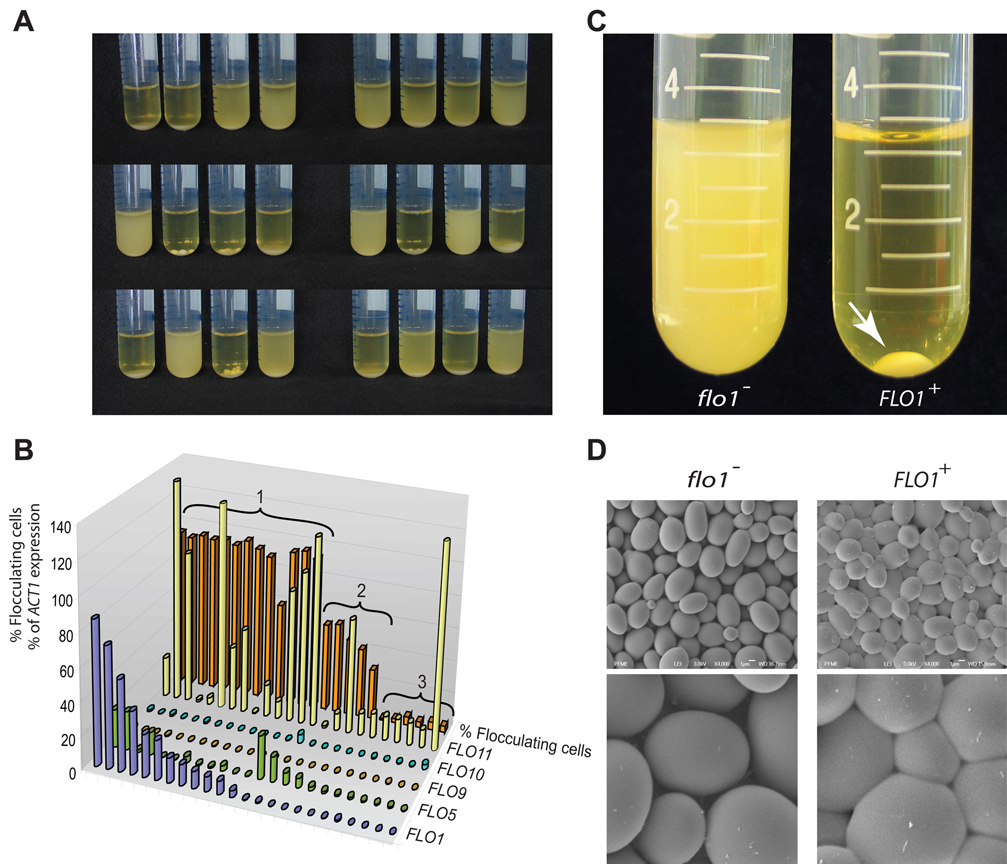
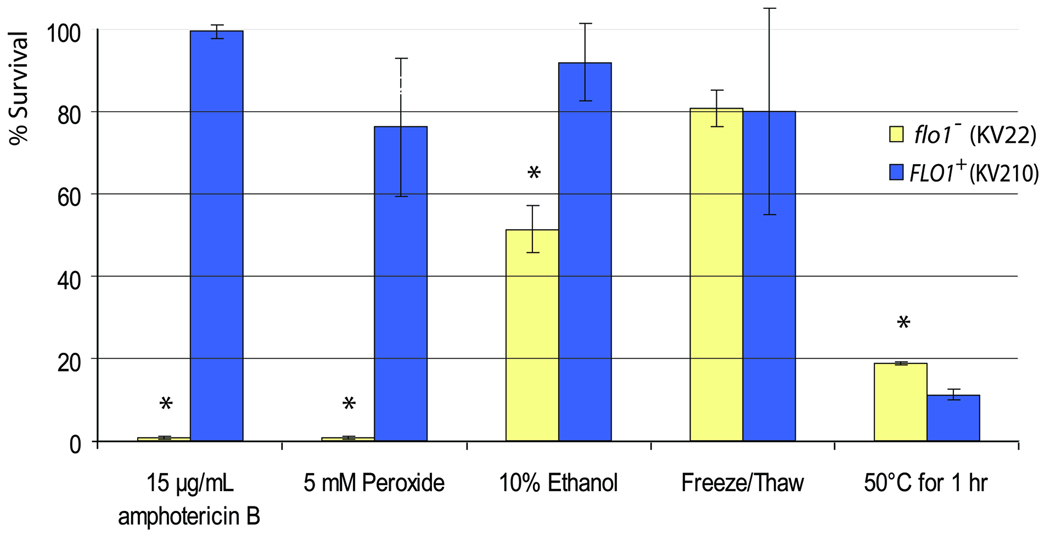
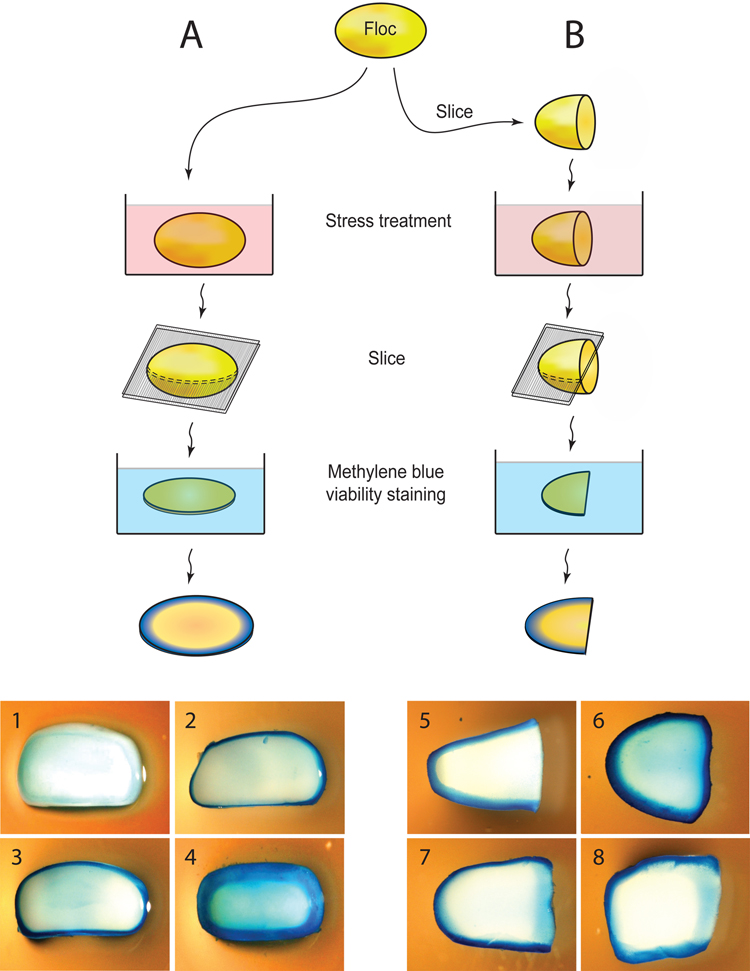
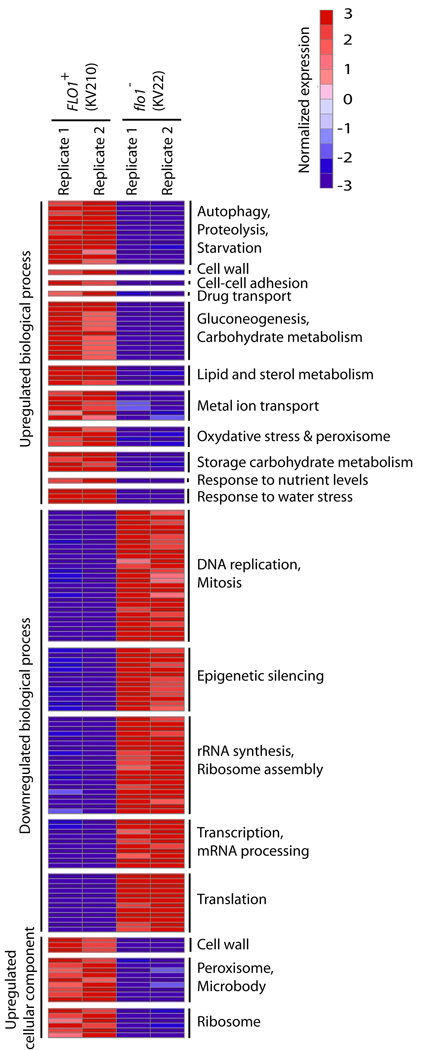
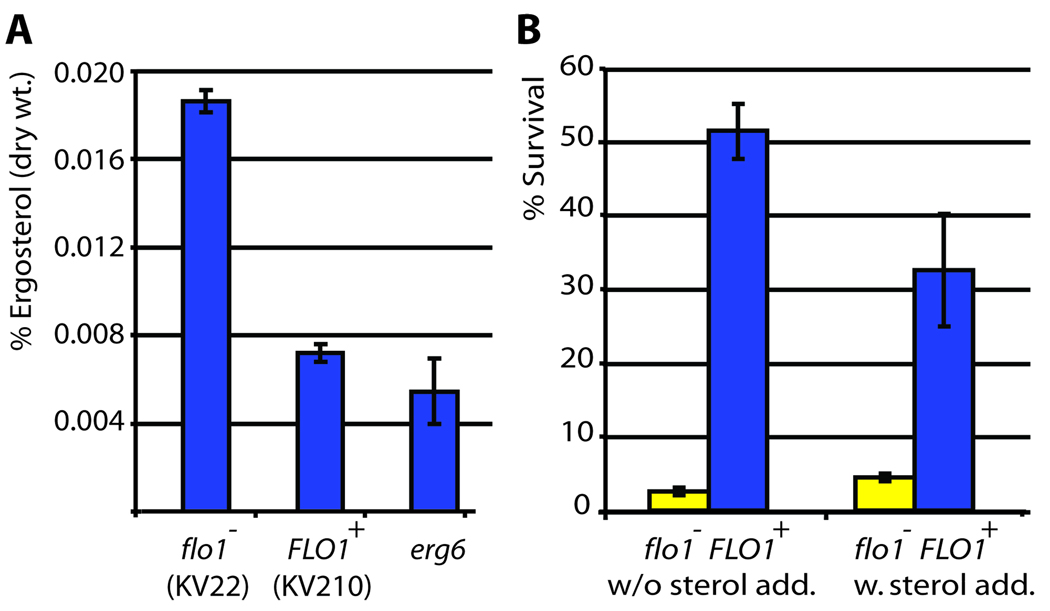
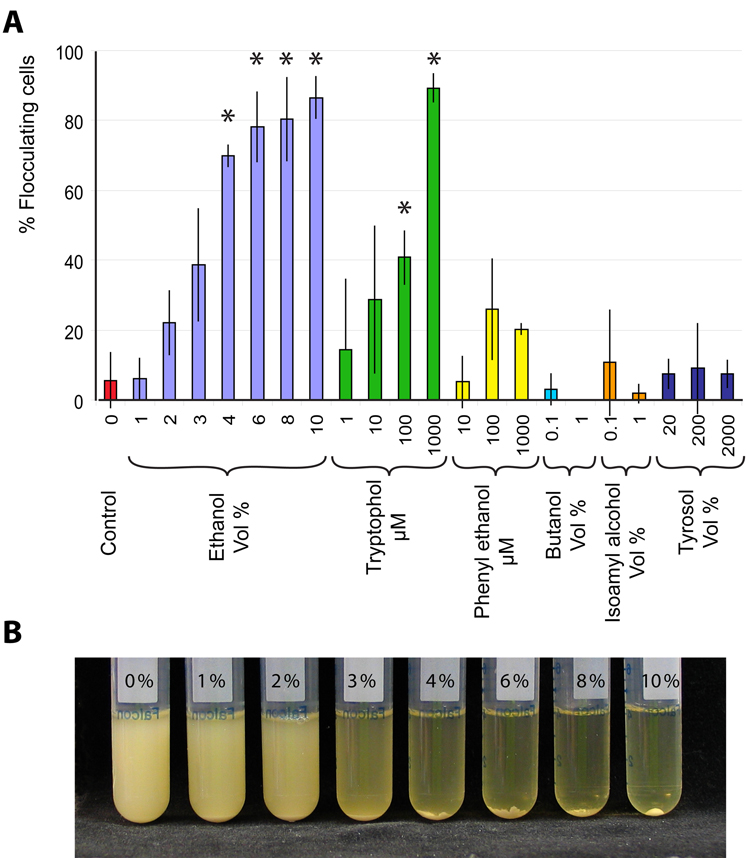
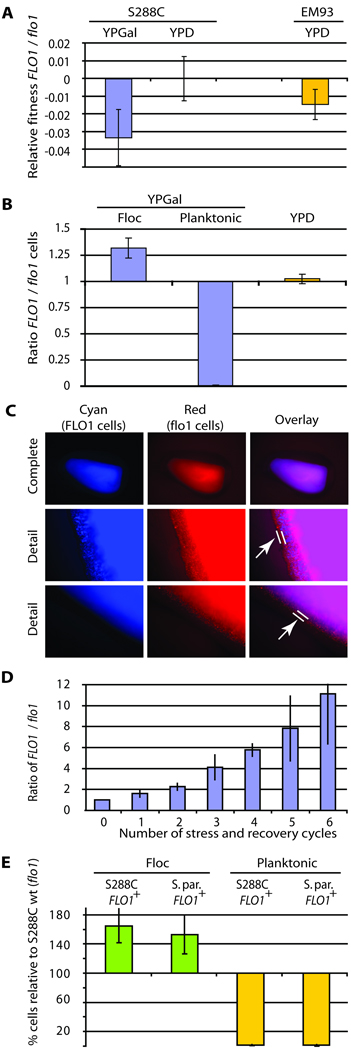
The budding yeast, Saccharomyces cerevisiae, has emerged as an archetype of eukaryotic cell biology. Here we show that S. cerevisiae is also a model for the evolution of cooperative behavior by revisiting flocculation, a self-adherence phenotype lacking in most laboratory strains. Expression of the gene FLO1 in the laboratory strain S288C restores flocculation, an altered physiological state, reminiscent of bacterial biofilms. Flocculation protects the FLO1 expressing cells from multiple stresses, including antimicrobials and ethanol. Furthermore, FLO1(+) cells avoid exploitation by nonexpressing flo1 cells by self/non-self recognition: FLO1(+) cells preferentially stick to one another, regardless of genetic relatedness across the rest of the genome. Flocculation, therefore, is driven by one of a few known "green beard genes," which direct cooperation toward other carriers of the same gene. Moreover, FLO1 is highly variable among strains both in expression and in sequence, suggesting that flocculation in S. cerevisiae is a dynamic, rapidly evolving social trait.


Figures

Figure 1
Figure 1. FLO1 confers strong flocculation in S. cerevisiae
A. Haploid derivatives of the feral strain EM93 show a wide variation in flocculation behavior when grown in rich YPD medium. Some strains flocculate strongly, so that all cells clump together and sink to the bottom of the tube, while others show virtually no flocculation, leaving all cells in suspension. B. Flocculation and expression of the five known flocculation (FLO) genes was quantified in 24 haploid EM93 strains. Strains were divided into three groups. Group 1 shows expression of FLO1 (at least 1% of ACT1 levels), Group 2 shows expression of FLO5, but not FLO1, and Group 3 does not show expression of either FLO1 or FLO5. Strains from Group 1 generally showing strong flocculation (>85%), Group 2 intermediate flocculation (20–50%) and Group 3 no flocculation (< 5%). C. The FLO1 gene of the nonflocculent laboratory strain S288C was brought under the transcriptional control of the inducible GAL1 promoter (KV210). When this strain is grown in YPGal medium, FLO1 is expressed, resulting in strong flocculation (arrow). A control strain (KV22) containing the same resistance marker gene, but not the promoter, does not show flocculation. D. Scanning electron microscopy of centrifuged pellets of nonflocculent (KV22) and flocculent (KV210) S288C cells shows that the flocculent cells stick together to form a densely packed three dimensional structure with little intercellular space. By contrast, the (centrifuged) nonflocculent cells behave as stacked independent spheres with clear gaps between the cells.
Figure 2
Figure 2. Flocculation confers resistance to certain stresses
S. cerevisiae cells with (KV210) and without (KV22) FLO1 expression were subjected to various stress treatments, after which the percentage of surviving cells was determined. Asterisks indicate statistically significant differences between flocculent and nonflocculent cultures (α = 0.05); error bars correspond to standard deviation.
Figure 3
Figure 3. Flocculating cells are physically shielded from the external milieu
A. Integral flocs were submerged in medium containing lethal levels of amphotericin B or ethanol. The flocs were subsequently sliced into thin sections and stained for viability using methylene blue, a dye that stains dead cells blue, while live cells remain white. (1) Control (no ethanol or amphotericin B); (2.) 100 µg ml−1 amphotericin B for 45 minutes; (3) 70% ethanol for 1 minute; (4) 70% ethanol for 45 minutes. B. Flocs were first cut in half before they were subjected to a stress treatment. (5) Control, with 45 min. amphotericin B treatment prior to slicing and staining the floc (note that this control was not sliced in half prior to treatment); (6) sliced before treating with 70% ethanol; (7) sliced before treatment with 100 µg ml−1 amphotericin B; (8) sliced before treatment with 15% ethanol. Note how for these intermediate conditions (7 and 8), cells that were originally situated in the heart of the floc (right-hand edge of specimens) are stained less than cell at the original periphery, but more than cells that remained shielded within the floc during stress treatment.
Figure 4
Figure 4. Flocculating and non-flocculating cells show differential expression of several gene clusters
Genes were grouped into standard Gene Ontology (GO) sets. All GO gene sets that differ significantly between flocculating and non-flocculating cells are shown (rows). These sets are grouped together based on a higher-order category (labels in the right). For each gene set, the median expression of the leading-edge genes is shown. Expression was normalized by mean centering and unit scaling prior to visualization. Red and blue respectively represent induction and repression as compared to average across all experiments. See materials and methods and supplemental data online for more details.
Figure 5
Figure 5. Lack of sterols in flocculating cells contributes to amphotericin B resistance
Ergosterol levels of planktonic cells (KV22), flocculating cells (KV210) and cells defective in ergosterol sythesis (erg6 deletion) were measured. A. Calculated sterol levels. Both KV210 and the erg6 mutant show statistically significant lower ergosterol levels compared to the WT control (α = 0.05). B. Survival of nonflocculent (KV22) and flocculent (KV210) strains after amphotericin B treatment. In a first assay (left), no sterols were added to the growth medium. For the second assay, ergosterol was added to the growth medium (final concentration 20 µg ml−1). Flocculating cells survive significantly less when sterols are added to the medium; while nonflocculent cells survived slightly better. All pairwise differences within and between treatments are statistically significant (α = 0.05), error bars indicate standard deviation.
Figure 6
Figure 6. Ethanol and the quorum sensing molecule tryptophol induce flocculation in the feral EM93 strain
Cultures of S. cerevisiae EM93 were grown in standard rich medium (YPD) with or without the addition of various known quorum sensing molecules and analogues thereof. A. Measurement of flocculation. Error bars represent standard deviation, asterisks indicate statistically significant differences from the control (i.e. no addition of any agent) (α = 0.05). B. Increasing flocculation of EM93 cultures observed with increasing concentration of ethanol.
Figure 7
Figure 7. FLO1 is a Green Beard gene
A. FLO1 expression comes at a fitness cost. Strain KV210 (FLO1 driven by the inducible GAL1 promoter) shows a significant (3%) fitness defect compared to strain KV22 (flo1) when grown in YPGal medium, but not in YPD (where FLO1 is not induced, control). A significant (1.5%) fitness defect was also observed when a naturally flocculating FLO1+ EM93 strain was compared to its flo1 null mutant, demonstrating that natural expression of FLO1 also has a fitness cost. For all these experiments, the medium was supplemented with mannose (to block flocculation and only measure the cost associated with FLO1 expression, not flocculation; see text). Error bars represent 95% confidence intervals. B. FLO1 cells preferentially aggregate together. Cultures were inoculated with equal proportions of flocculating (KV210) and non-flocculating (KV22) cells. After induction of flocculation, the relative proportion of flocculating and non-flocculating cells in the planktonic and flocculating cell populations was measured, revealing an unequal distribution, with flocculating cells preferentially embedded within flocs, and the majority of nonflocculent “cheater” cells in the planktonic phase (P < 0.01). In YPD medium (no FLO1 expression, no flocculation), the fractions of both cell types remain equal. Error bars represent 95% confidence intervals. C. Fluorescence microscopy of flocs obtained from mixed cultures shows that flocs consist of perfectly mixed flocculent cells (KV210, Cyan) and non-flocculent “cheater” cells (KV22, Red). However, the outermost layer of the floc is almost exclusively made up out of nonflocculent cells (arrow). D. Mixed cultures of FLO1-expressing and flo1 cheater cells subjected to consecutive cycles of stress treatments show a gradual increase in FLO1-expressing cells. Cultures were inoculated with equal proportions of flocculating (KV210) and non-flocculating (flo1 KV22) cells. After 20 hours of growth in YPGal medium (to induce FLO1 expression in KV210), the mixed cultures were subjected to a 4h amphotericin treatment. After the treatment, the dead planktonic cells were removed. The remaining cells were washed, deflocculated and used to re-inoculate a fresh YPGal culture, which was again subjected to stress treatment after 20 h of growth. In these 20 hours, FLO1+ cells went through an average of 8.9 cell doublings, while flo1 cheaters divided about 9.4 times. After each cycle, the ratio of FLO1-expressing cells to flo1 cheater cells increases, indicating that these conditions strongly select for FLO1-expressing cells. A similar trend was observed when naturally flocculating (FLO1-expressing) and non-flocculating (FLO1-silent) EM93 strains were used (not shown). Error bars represent standard deviations. E. S. paradoxus and S. cerevisiae cells expressing FLO1 co-flocculate and exclude S. cerevisiae flo1 “cheater” cells. Three strains were co-cultivated: S. cerevisiae S288C (flo1); S. cerevisiae KV210 (FLO1+) and a recombinant S. paradoxus strain that expresses the S. cerevisiae FLO1 gene. The graph shows the relative enrichment in flocs (green) and depletion in the planktonic fraction (yellow) of the two flocculent strains relative to the nonflocculent S288C wild-type cells (p < 0.01). FLO1-expressing S. cerevisiae and S. paradoxus cells co-flocculate and exclude S. cerevisiae cells that do not express FLO1, despite the closer genetic relatedness of the two S. cerevisiae strains. Error bars represent 95% confidence intervals.

Comment in

References

    1. Alimardani P, Regnacq M, Moreau-Vauzelle C, Ferreira T, Rossignol T, Blondin B, Berges T. SUT1-promoted sterol uptake involves the ABC transporter Aus1 and the mannoprotein Dan1 whose synergistic action is sufficient for this process. Biochem J. 2004;381:195–202. - PMC - PubMed
    1. Arthington-Skaggs BA, Lee-Yang W, Ciblak MA, Frade JP, Brandt ME, Hajjeh RA, Harrison LH, Sofair AN, Warnock DW. Comparison of visual and spectrophotometric methods of broth microdilution MIC end point determination and evaluation of a sterol quantitation method for in vitro susceptibility testing of fluconazole and itraconazole against trailing and nontrailing Candida isolates. Antimicrob Agents Chemother. 2002;46:2477–2481. - PMC - PubMed
    1. Beauvais A, Schmidt C, Guadagnini S, Roux P, Perret E, Henry C, Paris S, Mallet A, Prevost MC, Latge JP. An extracellular matrix glues together the aerial-grown hyphae of Aspergillus fumigatus. Cell Microbiol. 2007;9:1588–1600. - PubMed
    1. Chen H, Fink GR. Feedback control of morphogenesis in fungi by aromatic alcohols. Genes Dev. 2006;20:1150–1161. - PMC - PubMed
    1. Chen H, Fujita M, Feng Q, Clardy J, Fink GR. Tyrosol is a quorum-sensing molecule in Candida albicans. Proc Natl Acad Sci U S A. 2004;101:5048–5052. - PMC - PubMed

Publication types

Associated data