. 2008 Nov 14;135(4):738-48.
doi: 10.1016/j.cell.2008.10.028.

A translational profiling approach for the molecular characterization of CNS cell types

Affiliations

A translational profiling approach for the molecular characterization of CNS cell types

Myriam Heiman et al. Cell. .

Abstract

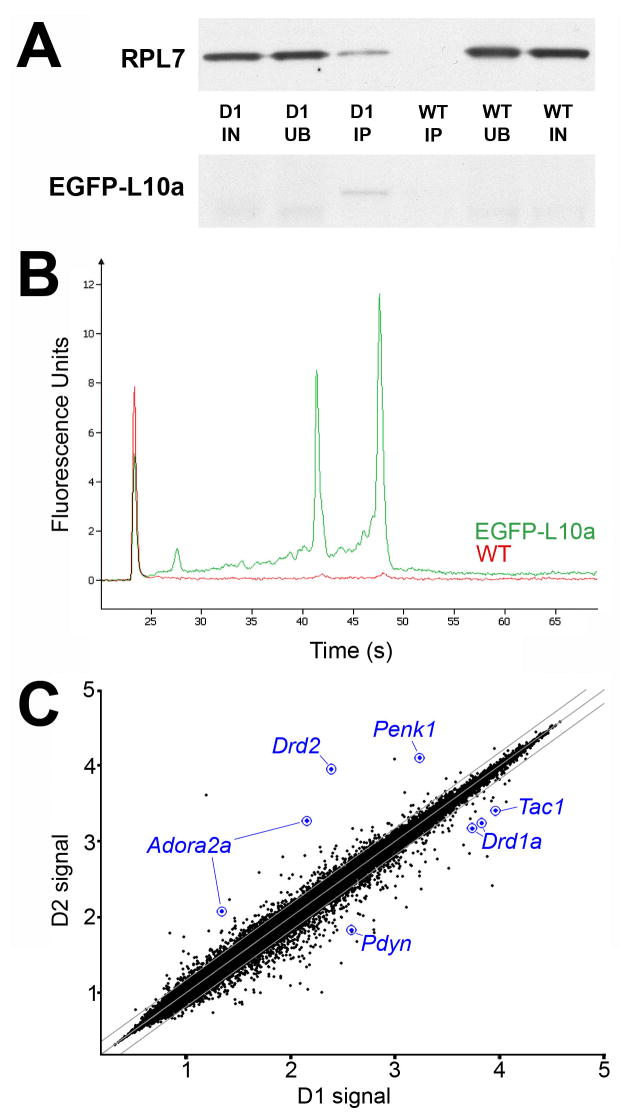
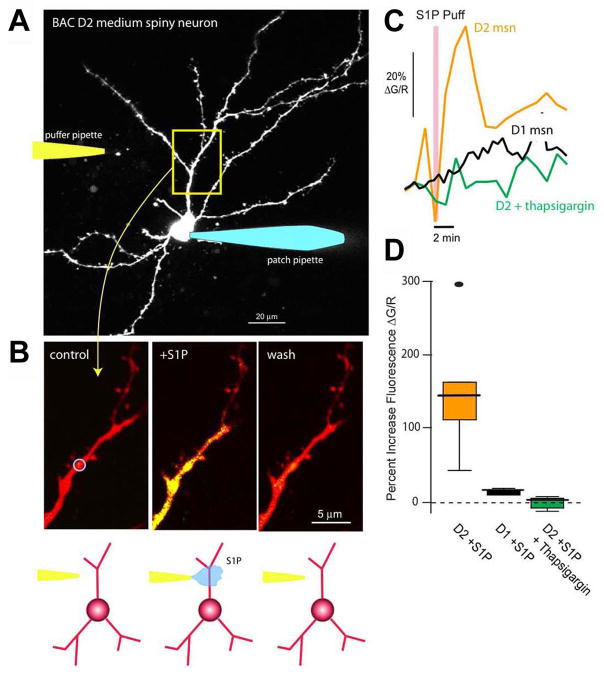
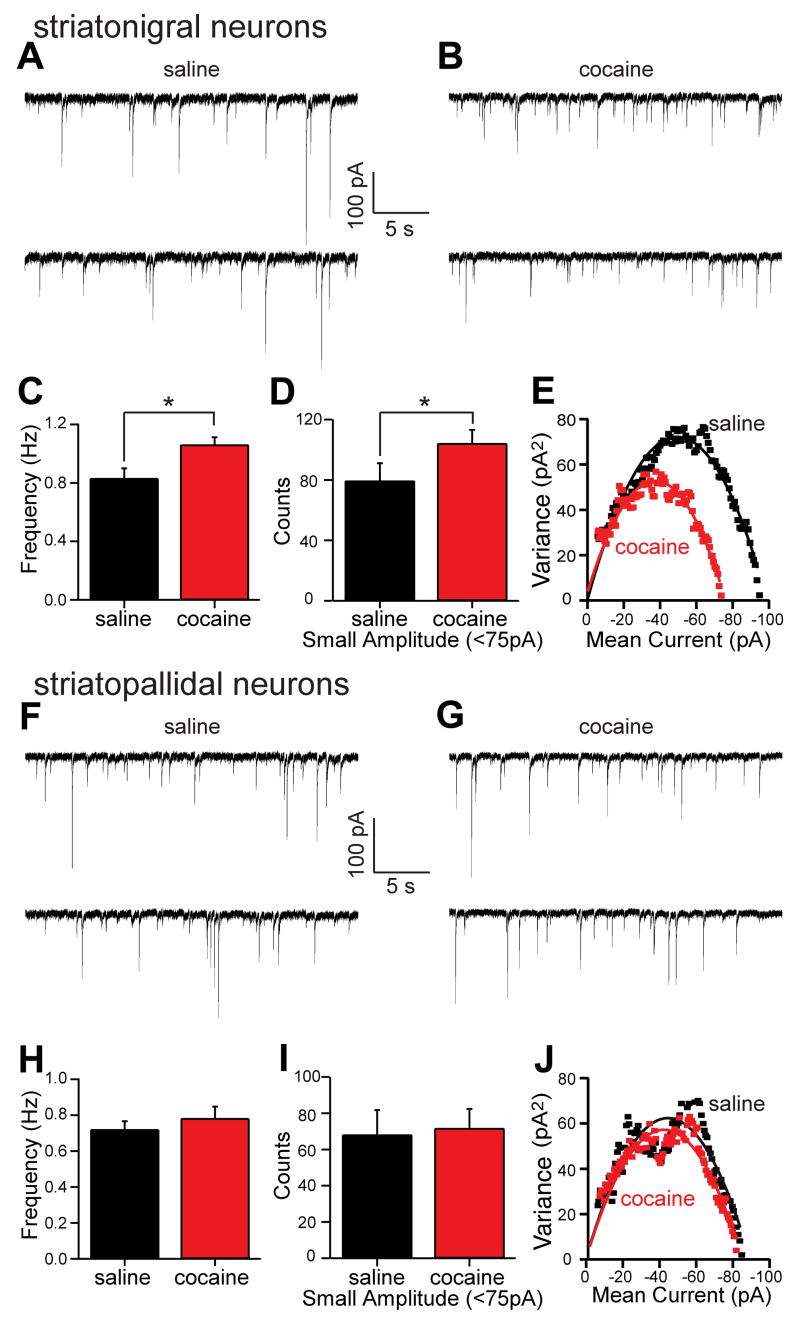
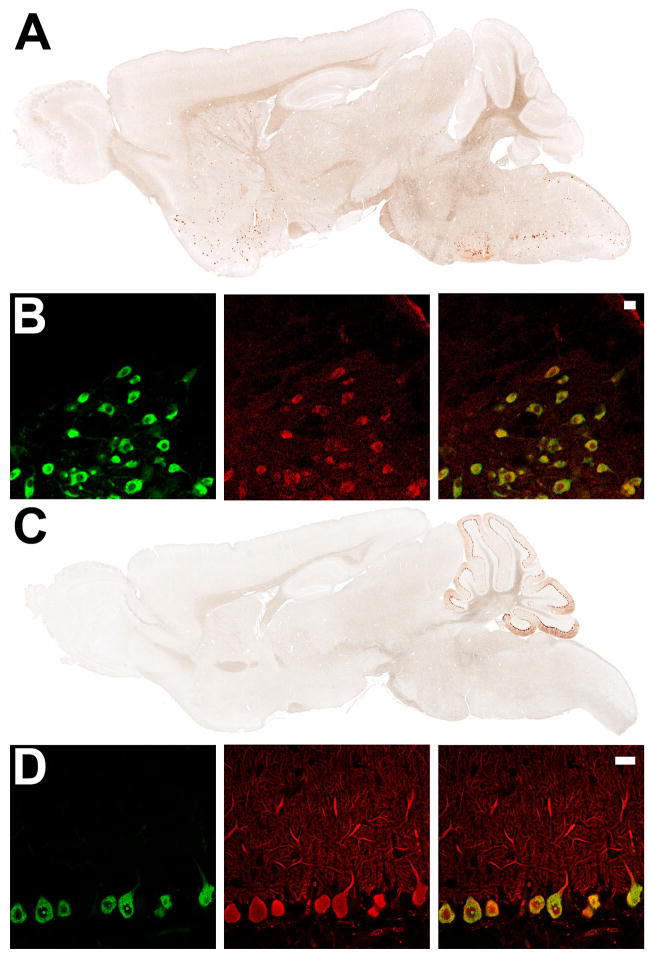
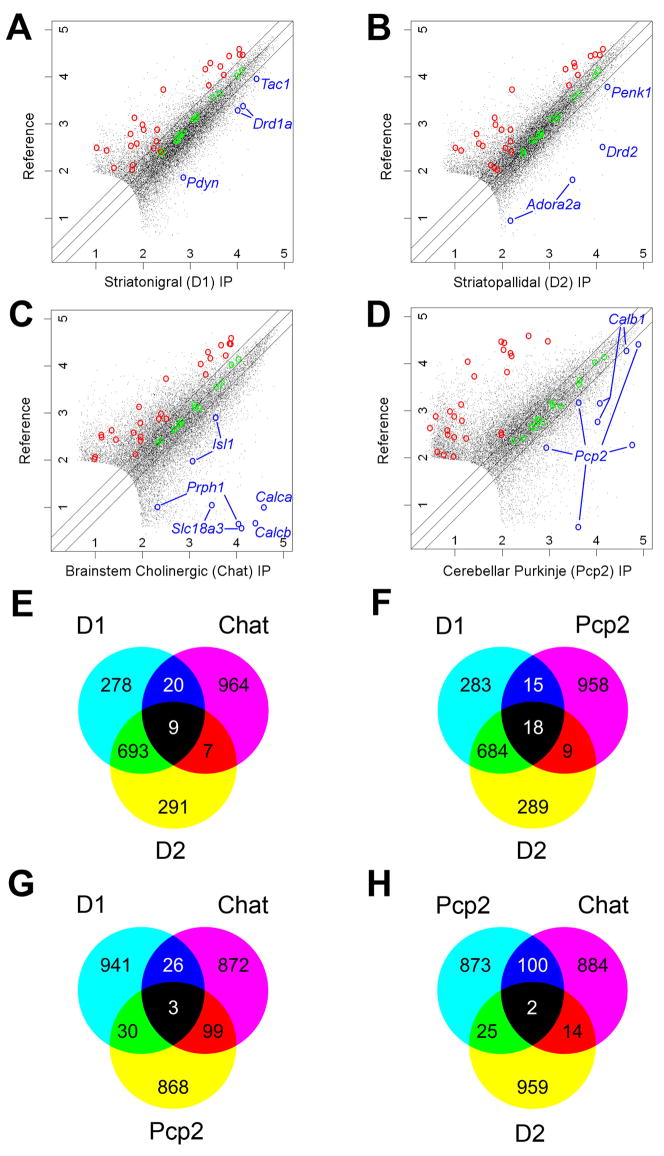
The cellular heterogeneity of the brain confounds efforts to elucidate the biological properties of distinct neuronal populations. Using bacterial artificial chromosome (BAC) transgenic mice that express EGFP-tagged ribosomal protein L10a in defined cell populations, we have developed a methodology for affinity purification of polysomal mRNAs from genetically defined cell populations in the brain. The utility of this approach is illustrated by the comparative analysis of four types of neurons, revealing hundreds of genes that distinguish these four cell populations. We find that even two morphologically indistinguishable, intermixed subclasses of medium spiny neurons display vastly different translational profiles and present examples of the physiological significance of such differences. This genetically targeted translating ribosome affinity purification (TRAP) methodology is a generalizable method useful for the identification of molecular changes in any genetically defined cell type in response to genetic alterations, disease, or pharmacological perturbations.


Figures

Figure 1
Figure 1. The BACarray Methodology
(A) Schematic of affinity purification of EGFP-tagged polysomes (originating from the target cell population; green polysomes) using anti-GFP antibody-coated beads. (B) Transmission electron micrographs of anti-GFP coated magnetic beads after incubation with extracts taken from HEK293T cells transfected with an empty vector (left panel) or the EGFP-L10a construct (right panel); images acquired at 50,000x magnification, inserts enlarged by a factor of 2.3x.
Figure 2
Figure 2. Expression of EGFP-L10a in D1 and D2 BACarray lines
(A) Immunohistochemistry to EGFP in adult sagittal sections from the D2 BACarray line CP101. (B) Characterization of D2 BACarray line CP101 striatal MSN cells: direct EGFP fluorescence (left panel with high-magnification image insert); enkephalin immunohistochemical staining (middle panel); merge (right panel, with 20 μm scale bar). (C) Immunohistochemistry to EGFP in adult sagittal sections from the D1 BACarray line CP73. (D) Characterization of D1 BACarray line CP73 striatal MSN cells: direct EGFP fluorescence (left panel); enkephalin immunohistochemical staining (middle panel); merge (right panel).
Figure 3
Figure 3. Protein and mRNA purification from BACarray lines
(A) Representative purification of EGFP-tagged L10a and co-purification of untagged ribosomal protein L7 from D1 BACarray animals but not wild-type littermates (D1, samples from D1 BACarray mice; WT, samples from wild-type littermates; IN, 1% Input; UB, 1% Unbound; IP, 6.5% Immunoaffinity purified sample). EGFP-L10a signal is only present in the D1 IP lane because the IP samples were more concentrated relative to IN and UB. (B) Representative purification of 18S and 28S rRNA from D1 BACarray transgenic animals (green) but not wild type littermates (red) as detected by Bioanalyzer PicoChips (Agilent Technologies). 28S rRNA runs at ~47 sec, 18S rRNA runs at ~43 sec, and the Picochip marker peak runs at ~23 sec. (C) Normalized expression values from Affymetrix Mouse Genome 430 2.0 arrays are plotted for D1 and D2 BACarray samples. Middle diagonal line represents equal expression, and lines to each side represent 1.5-fold enrichment in either cell population. Axes are labelled for expression in powers of 10. The probesets of well-studied genes known to be differentially expressed are represented in blue.
Figure 4
Figure 4. Functional Gpr6 receptors are found in BAC D2 striatopallidal but not BAC D1 striatonigral medium spiny neurons (MSNs)
(A) Projection of an EGFP-labeled MSN from a BAC D2 mouse. The cell was patched with a pipette containing Alexa 594 (50 μM) for visualization and Fluo-4 (200 μM) for measuring changes in intracellular Ca2+ (right). Cells were voltage clamped at −70 mV. A puffer pipette containing sphingosine 1-phosphate (S1P, 10 μM) was positioned near a dendrite, 60–80 μm from the soma (left/cartoon). (B) High magnification images of a dendritic segment (control, left panel) show an increase in Ca2+ associated with S1P application (S1P puff, center panel) that reversed with washing (wash, right panel). The change in Ca2+ was determined by calculating the percent change in fluorescence of Fluo-4 relative to that of Alexa 594 ( G/R). The blue circle in the first panel indicates the analyzed region of interest (ROI). (C) Time course showing the S1P induced increase in intracellular Ca2+ in the ROI from B (orange trace); similar recordings from BAC D1 MSNs (black trace) or 10 μM thapsigargin loaded BAC D2 MSNs (green trace) did not reveal any significant changes in dendritic Ca2+ levels with S1P application. (D) Box plot summarizing the S1P effects. Percent increase in fluorescence (ΔG/R) in BAC D2 MSNs (median=146%, range 44 to 294%, n=6); BAC D1 MSNs (median=17%, range 13 to 22%, n=4); and thapsigargin-loaded BAC D2 MSNs (median=4%, range –9 to 10%, n=4).
Figure 5
Figure 5. Cocaine treatment increases the frequency of small amplitude GABAergic mIPSCs in BAC D1 striatonigral medium spiny neurons (MSNs)
(A) Representative spontaneous mIPSCs traces from BAC D1 striatonigral neurons (expressing soluble EGFP under the D1 promoter) taken from mice treated for 15 days with saline or (B) cocaine (20 mg/kg/day). (C) Bar graph summary of mean mIPSC frequency showing a significant increase in BAC D1 striatonigral neuron mIPSCs frequency following cocaine treatment. (D) Bar graph summary showing that the number of small amplitude mIPSCs (<75 pA) in equal length records (7 min) increased in BAC D1 striatonigral neurons following cocaine treatment. (E) Representative variance-mean current plots from saline treated (black symbols) and cocaine treated (red symbols) BAC D1 neurons suggesting that the cocaine-induced small amplitude events arise from synapses that have fewer GABAA receptors (N) per synapse but receptors with an unchanged unitary receptor conductance (N) (saline N=33, N=31pS; cocaine N=29, N=31pS; see Figure S6C -D for means). (F) Representative spontaneous mIPSCs traces from BAC D2 striatopallidal neurons following saline treatment for 15 days and (G) following cocaine treatment for 15 days. (H) Bar graph summary of mean mIPSC frequency in saline and cocaine treated D2 neurons, showing no effect of treatment condition. (I) Bar graph summary showing that the number of small amplitude mIPSCs (<75 pA) in equal length records (7 min) was not altered by treatment condition in BAC D2 neurons. (J) Representative variance-mean current plots showing that cocaine treatment did not change in the number of receptors per synapse or the unitary receptor conductance in BAC D2 neurons (saline N=34, N=31pS; cocaine N=33, N=30pS; see Figure S7C –D for means).
Figure 6
Figure 6. Expression of EGFP-L10a in the Chat and Purkinje cell BACarray lines
(A) Immunohistochemistry to EGFP in adult sagittal sections from the Chat BACarray line DW167. (B) Indirect immunofluorescent characterization of Chat BACarray line DW167 brain stem facial motor nucelus: EGFP staining (left panel); Chat staining (middle panel) and merge (right panel, with 20 μm scale bar). (C) Immunohistochemistry to EGFP in adult sagittal sections from the Pcp2 BACarray line DR166. (D) Indirect immunofluorescent characterization of Pcp2 BACarray line DR166 Purkinje cell neurons: EGFP staining (left panel); Calbindin-D28K staining (middle panel) and merge (right panel, with 20 μm scale bar).
Figure 7
Figure 7. BACarray profiles recapitulate known cell-specific markers and reveal new ones for four distinct cell types
Scatterplots of D1, D2, Chat, and Pcp2 BACarray data compared to a reference mRNA sample reveal hundreds of genes enriched in each cell type (A–D). Green circles indicate Affymetrix biotinylated spike-in controls; blue circles indicate known cell-specific markers; and red circles indicate probesets for known glial genes (negative controls; Table S26). Lines on either side of the diagonal mark 2-fold enrichment. Axes are labelled for expression in powers of 10. Venn diagrams of the top 1,000 enriched probesets (with expression value cut-off >100) for each cell type reveal that each cell type has a unique pattern of enriched genes (E–H).

Comment in

References

    1. Ashburner M, Ball CA, Blake JA, Botstein D, Butler H, Cherry JM, Davis AP, Dolinski K, Dwight SS, Eppig JT, et al. Gene ontology: tool for the unification of biology. The Gene Ontology Consortium. Nat Genet. 2000;25:25–29. - PMC - PubMed
    1. Brakeman PR, Lanahan AA, O’Brien R, Roche K, Barnes CA, Huganir RL, Worley PF. Homer: a protein that selectively binds metabotropic glutamate receptors. Nature. 1997;386:284–288. - PubMed
    1. Castets F, Bartoli M, Barnier JV, Baillat G, Salin P, Moqrich A, Bourgeois JP, Denizot F, Rougon G, Calothy G, Monneron A. A novel calmodulin-binding protein, belonging to the WD-repeat family, is localized in dendrites of a subset of CNS neurons. J Cell Biol. 1996;134:1051–1062. - PMC - PubMed
    1. Chang CW, Tsai CW, Wang HF, Tsai HC, Chen HY, Tsai TF, Takahashi H, Li HY, Fann MJ, Yang CW, et al. Identification of a developmentally regulated striatum-enriched zinc-finger gene, Nolz-1, in the mammalian brain. Proc Natl Acad Sci U S A. 2004;101:2613–2618. - PMC - PubMed
    1. Day M, Wang Z, Ding J, An X, Ingham CA, Shering AF, Wokosin D, Ilijic E, Sun Z, Sampson AR, et al. Selective elimination of glutamatergic synapses on striatopallidal neurons in Parkinson disease models. Nat Neurosci. 2006;9:251–259. - PubMed

Publication types

Associated data