. 2009 Jan 15;325(2):444-67.
doi: 10.1016/j.ydbio.2008.10.021. Epub 2008 Nov 5.

Transcription factor expression dynamics of early T-lymphocyte specification and commitment

Affiliations

Transcription factor expression dynamics of early T-lymphocyte specification and commitment

Elizabeth-Sharon David-Fung et al. Dev Biol. .

Abstract

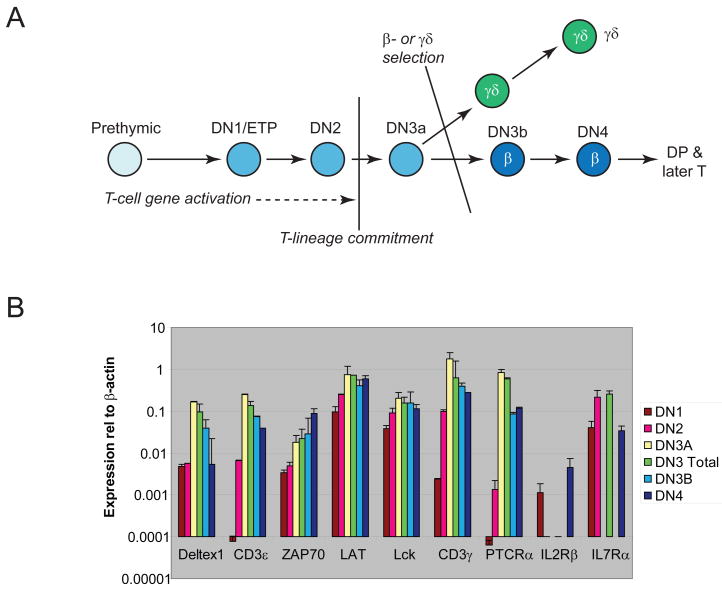
Mammalian T lymphocytes are a prototype for development from adult pluripotent stem cells. While T-cell specification is driven by Notch signaling, T-lineage commitment is only finalized after prolonged Notch activation. However, no T-lineage specific regulatory factor has been reported that mediates commitment. We used a gene-discovery approach to identify additional candidate T-lineage transcription factors and characterized expression of >100 regulatory genes in early T-cell precursors using realtime RT-PCR. These regulatory genes were also monitored in multilineage precursors as they entered T-cell or non-T-cell pathways in vitro; in non-T cells ex vivo; and in later T-cell developmental stages after lineage commitment. At least three major expression patterns were observed. Transcription factors in the largest group are expressed at relatively stable levels throughout T-lineage specification as a legacy from prethymic precursors, with some continuing while others are downregulated after commitment. Another group is highly expressed in the earliest stages only, and is downregulated before or during commitment. Genes in a third group undergo upregulation at one of three distinct transitions, suggesting a positive regulatory cascade. However, the transcription factors induced during commitment are not T-lineage specific. Different members of the same transcription factor family can follow opposite trajectories during specification and commitment, while factors co-expressed early can be expressed in divergent patterns in later T-cell development. Some factors reveal new regulatory distinctions between alphabeta and gammadelta T-lineage differentiation. These results show that T-cell identity has an essentially complex regulatory basis and provide a detailed framework for regulatory network modeling of T-cell specification.


Figures

Figure 1
Figure 1
Landmarks for early T-cell lineage development. (A) Diagram of stages of early T-cell development. (B) Expression of T-cell differentiation genes at successive stages of T-cell development. Samples are from “Series B”, except that Il2rb and Il7ra are shown for samples from Series A. For primer sequences, see Table 3 and (Taghon et al., 2007; Franco et al., 2006). Gene expression levels are expressed in units relative to β-actin measured in the same samples.
Figure 2
Figure 2
Regulatory gene expression patterns through early T cell development. Gene expression levels are shown for the putative regulatory genes in this study, arranged alphabetically in order of gene names. Gene expression levels are measured by qPCR using primers shown in Table 3, and the geometric means of values determined from the two independent sets within each series are plotted on a log10 scale relative to the expression of β-actin in the same samples (0 = log101 = level of β-actin). Data from both “Series A” and “Series B” are combined in these graphs, with Series A measurements joined by continuous line spline curves and Series B measurements joined by broken-line spline curves. One group of Series B measurements that were determined separately from all the others is indicated by dotted curves (Mitf, Sox4, Bcl11a, Cebpa, and one set of Zfpm1). Where the same genes were analyzed in both series, both sets of values are shown. In some cases (SpiB-1, SpiB-2; LRF, LRF*), the same genes are assayed with different primer sets. LRF* = primers from Maeda et al. (Maeda et al., 2007). GATA-3-r = GATA-3 reassayed on the same Series B samples with the same primers, but by a different investigator > 1 yr after initial Series B measurement (David-Fung et al., 2006); included to show reproducibility. To align the Series A samples (DN1, 2, 3, and 4) with the Series B samples (DN1, 2, 3a, 3b, and 4), values were plotted on an x/y plot in which DN1 was considered “1”; DN2 was considered “2”; DN3a was considered “3.0”; DN3b was considered “3.7”; DN3 (unseparated), which is mostly DN3a, was considered “3.2”; and DN4 was considered to be “4.5”. Thus, the β-selection checkpoint is represented by “3.5”. The same convention is followed in Figs. 4C–F and 6 as well.
Figure 3
Figure 3
Hierarchical clustering of putative regulatory genes based on pairwise correlations. (A) Genes tracked in Series A. (B) Genes tracked in Series B. “Cold maps” are shown to depict the correlation among gene expression patterns within each series, with blue representing full correlation and red representing full anticorrelation as described in Materials and Methods. All genes analyzed in each series are listed in the same order along both the y axis and the x axis of each plot, with the origin at the upper left, so that the diagonal represents the perfect correlations of each gene’s expression pattern with itself. The order of the genes on each axis is set by hierarchical clustering of expression patterns as shown at the left of each matrix, with red numbers indicating the closeness of relationship (low numbers: close; high numbers: remote; see Supplementary Methods). Note that in this hierarchical clustering order, the clusters drawn should be considered to have rotational symmetry. Blocks of color help to visualize genes that are regulated in parallel (blue blocks) or in significantly opposing ways (orange/red blocks) through early T-cell development. Three major groups of genes with decreasing, sustained (“legacy”), and increasing expression are identified with lines over particular blocks in Panel A. Series B was used in a targeted way to assay many genes known from sources other than this gene discovery study, and so panel B is more biased toward genes with diverse, highly inflected expression patterns.
Figure 4
Figure 4
Clusters of genes defined by expression patterns and pattern elements. (A, B) Self-organizing matrices of expression patterns of genes assayed in Series A (A) and Series B (B). Numbers of clusters and 2-row orientations were chosen to account for at least 84% of the overall variance of gene expression in each Series. Cluster number (c) and number of genes in the cluster are indicated at the top of each panel. Names of members of each of the clusters are listed in Supplementary Table 1; examples are shown in (C–F). (C) Genes in this study showing an increase from DN1 to DN3 of >3 fold. Data extracted from Fig. 2. (D) Genes in this study showing a decrease from DN1 to DN3 of >3 fold. (E) Genes with patterns featuring a major peak in expression at DN3 (DN3a) followed by a substantial decline. (F) Examples of genes showing steady “legacy” expression from DN1 to DN3, including all those with substantial decreases at β-selection. Note that distinctions between the groups in (C)–(F) are not clearcut. Certain genes, e.g. SpiB and Id2, have a “legacy” element of expression but may appear more appropriate for different categories when different primers are used (SpiB-1 vs. SpiB-2, DN3 peak) or in different sample series (Id2, declining). In some of these ambiguous cases the same gene data are shown in two panels to illustrate different pattern features, e.g. Id2, Zfp110 and Zfp287). Additional evidence for these pattern groupings comes from other independent measurements (Rothenberg et al., 2008; Taghon et al., 2006; Yui and Rothenberg, 2004).
Figure 4
Figure 4
Clusters of genes defined by expression patterns and pattern elements. (A, B) Self-organizing matrices of expression patterns of genes assayed in Series A (A) and Series B (B). Numbers of clusters and 2-row orientations were chosen to account for at least 84% of the overall variance of gene expression in each Series. Cluster number (c) and number of genes in the cluster are indicated at the top of each panel. Names of members of each of the clusters are listed in Supplementary Table 1; examples are shown in (C–F). (C) Genes in this study showing an increase from DN1 to DN3 of >3 fold. Data extracted from Fig. 2. (D) Genes in this study showing a decrease from DN1 to DN3 of >3 fold. (E) Genes with patterns featuring a major peak in expression at DN3 (DN3a) followed by a substantial decline. (F) Examples of genes showing steady “legacy” expression from DN1 to DN3, including all those with substantial decreases at β-selection. Note that distinctions between the groups in (C)–(F) are not clearcut. Certain genes, e.g. SpiB and Id2, have a “legacy” element of expression but may appear more appropriate for different categories when different primers are used (SpiB-1 vs. SpiB-2, DN3 peak) or in different sample series (Id2, declining). In some of these ambiguous cases the same gene data are shown in two panels to illustrate different pattern features, e.g. Id2, Zfp110 and Zfp287). Additional evidence for these pattern groupings comes from other independent measurements (Rothenberg et al., 2008; Taghon et al., 2006; Yui and Rothenberg, 2004).
Figure 5
Figure 5
Gene expression in thymocyte subpopulations with a genetic block to β-selection: early T vs. NK lineage gene expression. Realtime qPCR measurements are shown for subpopulations of thymocytes from B6. Rag2−/− mice, sorted as described previously (David-Fung et al., 2006; Anderson et al., 2002b; Wang et al., 1998). True DN1 cells are very rare in these thymus populations, but the Sca-1+ Thy-1low subset contains T-lineage precursor activity while pre-NK cells (Sca-1 Thy-1+/− CD24) are marked by strong perforin expression (David-Fung et al., 2006). Note distinctively high Tbx21 and Il2rb expression in the pre-NK cells.
Figure 6
Figure 6
Differential regulation of different members of the same transcription factor families. Gene expression data, extracted from Fig. 2, are shown for: (A) Ets, (B) Runx, and (C) Ikaros family members, and (D) for genes predicted to encode KRAB and SCAN domain-containing zinc finger factors.
Figure 7
Figure 7
Cell type specificity of gene expression induced in hematopoietic progenitors on OP9 stroma. Gene expression levels are shown in units relative to β-actin at successive two-day time points, starting from multipotent c-Kit+ CD27+ Lin hematopoietic precursors from fetal liver. Cells were cultured for up to ten days on OP9-control stroma, which does not permit T-cell development (blue shaded bars), and on OP9-DL1 stroma, which promotes T-cell development (brown to yellow shaded bars). Black bars show gene expression in input cells. Cultures were harvested for RNA preparation every two days. At day 4, cells from the cultures were collected and those retaining a precursor phenotype (c-Kit+ CD27+ Lin) were repurified before being placed in fresh cultures for the remaining 2–6 days (Taghon et al., 2005). Similar results were obtained in experiments where the cells were not repurified at an intermediate timepoint or were repurified at day 2 instead (data not shown). By 6 d, ~50% of cells in OP9-DL1 culture are at least DN2 stage, and ~30% of cells in OP9-control culture are CD19+ (Taghon et al., 2005). Genes transiently induced on either stroma (e.g. Il2rb, Cebpa) reflect abortive emergence of NK and myeloid cells (data not shown), which are then suppressed during sustained culture under OP9-control or OP9-DL1 conditions.

References

    1. Adachi S, Rothenberg EV. Cell-type-specific epigenetic marking of the IL2 gene at a distal cis-regulatory region in competent, nontranscribing T-cells. Nucleic Acids Res. 2005;33:3200–3210. - PMC - PubMed
    1. Aliahmad P, Kaye J. Development of all CD4 T lineages requires nuclear factor TOX. J Exp Med. 2008;205:245–256. - PMC - PubMed
    1. Anderson MK. At the crossroads: diverse roles of early thymocyte transcriptional regulators. Immunol Rev. 2006;209:191–211. - PubMed
    1. Anderson MK, Hernandez-Hoyos G, Diamond RA, Rothenberg EV. Precise developmental regulation of Ets family transcription factors during specification and commitment to the T cell lineage. Development. 1999;126:3131–3148. - PubMed
    1. Anderson MK, Hernandez-Hoyos G, Dionne CJ, Arias A, Chen D, Rothenberg EV. Definition of regulatory network elements for T-cell development by perturbation analysis with PU.1 and GATA-3. Devel Biol. 2002a;246:103–121. - PubMed

Publication types

Substances

LinkOut - more resources