. 2009 Feb;215(2):253-63.
doi: 10.1016/j.expneurol.2008.10.006. Epub 2008 Oct 28.

Neuronal survival and resistance to HIV-1 Tat toxicity in the primary culture of rat fetal neurons

Affiliations

Neuronal survival and resistance to HIV-1 Tat toxicity in the primary culture of rat fetal neurons

Marina V Aksenova et al. Exp Neurol. 2009 Feb.

Abstract

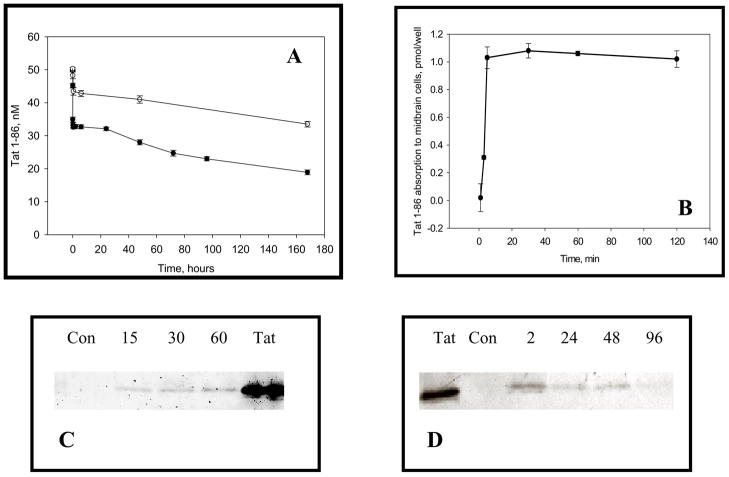
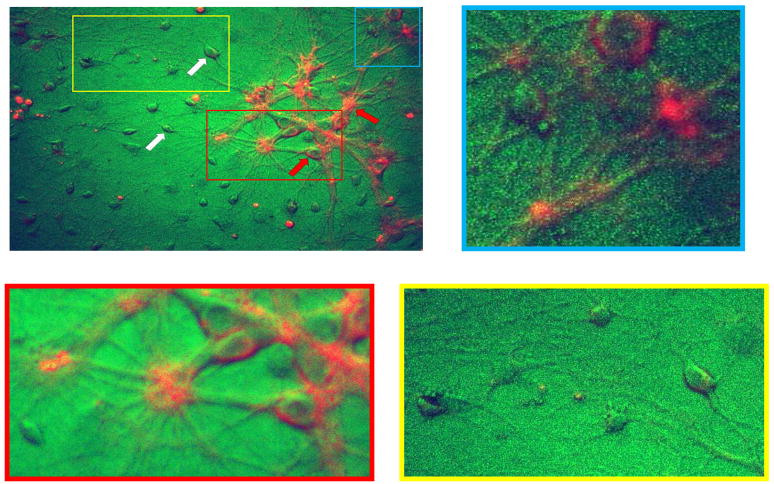
In this study we report that primary cultures of rat fetal neurons contain subpopulations of cells that may be sensitive or resistant to HIV-1 Tat neurotoxicity. We demonstrate that rapid binding/uptake of Tat 1-86 for 2 h was sufficient to trigger caspase activation and neurodegeneration in rat fetal midbrain cell cultures. The uptake of Tat was followed by an increase in MCP1 (CCL2) immunoreactivity. Approximately 70% of neurons were able to survive transient or continuous (7 days) Tat exposure. The surviving neurons did not contain bound/internalized Tat, but were able to interact with Tat after medium replacement. These neurons were resistant to Tat toxicity. In neurons that resisted the toxic effects of continuous and repeated Tat treatment, levels of NR2A subunit of the NMDA receptor complex were significantly lower than in controls. We suggest that the subunit composition of NMDAR complexes may be important for the sensitivity of neurons to Tat toxicity.


Figures

Figure 1
Figure 1
The dose-response and the time course of decreased neuronal cell viability in primary rat fetal midbrain cell culture exposed to HIV-1 Tat 1–86. A. The graph shows the decrease in Live/Dead ratios produced by different doses of recombinant Tat 1–86 after 48 hours of treatment. The relative (compared to non-treated controls) cell viability decrease was determined by the formula: (1− [F530nm/F645nm]well n/[F530nm/F645nm]average max) × 100%. Data presented as mean values, n of sister cultures analyzed = 6–15 per each Tat 1–86 concentration. B. The graph represents relative (compared to non-treated controls) changes in Live/Dead ratios following the addition of 50 nM Tat 1–86. Data presented as mean values, n of sister cultures analyzed = 7–12 per each time point. The curve represents the best fit equation for the set of mean values: a 4 parameter logistic curve. The best fit function was selected using SigmaPlot 8.0 Regression analysis.
Figure 2
Figure 2
Binding/uptake of Tat 1–86 by cultured rat fetal midbrain neurons during the continuous exposure of cell cultures to 50 nM dose of Tat. A. The graph shows changes in Tat 1–86 concentration (measured using anti-Tat ELISA) in the medium during continuous incubation with rat fetal midbrain cell cultures. The control curve shows results obtained from the wells containing only 50 nM Tat in the medium, but no rat fetal midbrain cells. Data presented as mean values ± SEM (n=3 per each time point). B. The graph shows amounts of Tat 1–86 per well specifically absorbed by midbrain cells during the first 2 hours of treatment. Data presented as mean values ± SEM (n=3 per each time point). Panel C shows the increase of bound/internalized Tat in cell lysates within 15–60 min after the addition of 50 nM Tat to the cell culture medium. Panel D shows the decrease of bound/internalized Tat in cell lysates during 2–96 hours of continuous exposure to 50 nM Tat 1–86.
Figure 3
Figure 3
The representative image of Tat immunoreactivity in rat fetal midbrain cell cultures exposed to 50 nM Tat 1–86 for 2 hours. Red arrowheads point at Tat-immunopositive cells, white arrowheads point at cells that do not contain Tat. Colored boxes mark areas of the selection, which are shown as new magnified images with greater resolution.
Figure 4
Figure 4
Caspase activity in rat fetal midbrain cell cultures continuously exposed to 50 nM Tat 1–86. Microscopic images of the caspase 9 activity (red fluorescence) in rat fetal midbrain cell cultures treated for 2 hr with Tat (Panel A) and in non-treated control (Panel B). The graph in Panel C shows the time course of total caspase activity in rat fetal midbrain cell cultures continuously exposed to 50 nM Tat 1–86. The graph represents relative (compared to non-treated controls) changes in CR-VAD- fluoromethyl ketone green fluorescence (normalized to Hoechst fluorescent signal) following the addition of 50 nM Tat 1–86. Data presented as mean values ± SEM, n of sister cultures analyzed = 7–12 per each time point. *- P<0.05.
Figure 5
Figure 5
Tat-containing growth medium remains neurotoxic after prolonged incubation with rat fetal midbrain neurons. Live/Dead ratios were determined 4 days (96 hours) after the replacement of the medium in test groups of non-treated cell cultures (n=12) with 96 hour-conditioned growth medium that contained (TCM 96) or did not contain (CM 96) Tat 1–86. The results were compared with control cultures in which the medium was not replaced. The second graph in the panel illustrates decreased toxicity of the conditioned medium from Tat-treated cell cultures after the removal of Tat by ultrafiltration. Graphs show relative (% versus control) changes in cell viability. Data presented as mean values ± SEM. *- P<0. 05. Dot-blots on the right side of each graph show results of testing of conditioned medium samples for Tat immunoreactivity.
Figure 6
Figure 6
The cell viability decrease in rat fetal midbrain cell cultures transiently exposed to 50 nM Tat 1–86. The graph represents relative (compared to non-treated controls) Live/Dead ratios determined 48 hours after the replacement of the medium in cultures pretreated with Tat for 2 hours and cultures that were not exposed to Tat (control group). Data presented as mean values ± SEM, n of sister cultures analyzed = 7–12 per each group. *- P<0. 05
Figure 7
Figure 7
Cell viability changes in rat primary neuronal cell cultures following the second Tat exposure. The graph shows the results of the repeated treatment of cultures that survived 96 hours of continuous exposure to Tat with a fresh portion of Tat-containing medium of the same concentration. The graph represents relative (compared to non-treated controls) Live/Dead ratios determined in cell cultures treated with 50 nM Tat for 96 hours and in surviving cell cultures that were re-exposed to 50 nM Tat 1–86 for either extra 48 or 96 hours. Data presented as mean values ± SEM, n of sister cultures analyzed = 7–12 per each group.
Figure 8
Figure 8
Tat 1–86 binding/uptake in rat primary neuronal cell cultures repeatedly treated with Tat 1–86. The image of Western blot illustrates the restoration of Tat bound/internalized immunoreactivity levels in cell lysates 2 hours after the replacement of 96 hour-old Tat-containing medium with a new 50 nM dose of Tat 1–86. Lane 1- lysate prepared from cell culture treated for 96 hours with 50 nM Tat 1–86. Lane 2- lysate prepared from the same culture in which old Tat-containing medium was replaced with new portion of 50 nM Tat (2 hour exposure). The image shows re-appearance of Tat-positive cells in the cultures pre-incubated with Tat for 96 hours. Image of Tat immunofluorescence was taken 2 hours after the addition of a new 50 nM Tat 1–86 dose.
Figure 9
Figure 9
Changes in MCP1 (CCL2) immunoreactivity in rat fetal midbrain cell cultures exposed to Tat. Microscopic image illustrates the presence of MCP1-immunopositive cells in rat fetal midbrain cell culture. The graph represents relative (compared to non-treated control) changes in MCP1 (CCL2) immunofluorescence normalized to Hoechst (cell density) fluorescent staining during the continuous exposure of cultures to 50 nM Tat 1–86. Data presented as mean values ± SEM, n of sister cultures analyzed = 6 per each group. *- P <0.05.
Figure 10
Figure 10
NMDA receptor subunits (NR1, NR2A, NR2B) immunoreactivity in rat fetal cultured neurons surviving the continuous exposure to Tat. The graph represents NR1, NR2A, NR2B immunofluorescence (A528/A460) normalized to Hoechst (cell density) fluorescent staining in control non-treated cell cultures and in cultures treated with 50 nM Tat 1–86 for 96 hours. Data presented as mean values ± SEM, n of sister cultures analyzed = 7–12 per each group. *- P<0.05.

References

    1. Aksenov MY, Aksenova MV, Nath A, Ray PD, Mactutus CF, Booze RM. Cocaine-mediated enhancement of Tat toxicity in rat hippocampal cell cultures: the role of oxidative stress and D1 dopamine receptor. Neurotoxicology. 2006;27:217–228. - PubMed
    1. Aksenova MV, Silvers JM, Aksenov MY, Nath A, Ray PD, Mactutus CF, Booze RM. HIV-1 Tat neurotoxicity in primary cultures of rat midbrain fetal neurons: changes in dopamine transporter binding and immunoreactivity. Neurosci Lett. 2006;395:235–239. - PubMed
    1. Albini A, Ferrini S, Benelli R, Sforzini S, Giunciuglio D, Aluigi MG, Proudfoot AE, Alouani S, Wells TN, Mariani G, Rabin RL, Farber JM, Noonan DM. HIV-1 Tat protein mimicry of chemokines. Proc Natl Acad Sci U S A. 1998;95:13153–13158. - PMC - PubMed
    1. Bonavia R, Bajetto A, Barbero S, Albini A, Noonan DM, Schettini G. HIV-1 Tat causes apoptotic death and calcium homeostasis alterations in rat neurons. Biochem Biophys Res Commun. 2001;288:301–308. - PubMed
    1. Banisadr G, Gosselin RD, Mechighel P, Rostène W, Kitabgi P, Mélik Parsadaniantz S. Constitutive neuronal expression of CCR2 chemokine receptor and its colocalization with neurotransmitters in normal rat brain: functional effect of MCP-1/CCL2 on calcium mobilization in primary cultured neurons. J Comp Neurol. 2005;492:178–192. - PubMed

Publication types

MeSH terms