

Searching for molecular markers in head and neck squamous cell carcinomas (HNSCC) by statistical and bioinformatic analysis of larynx-derived SAGE libraries
- PMID: 19014460
- PMCID: PMC2629771
- DOI: 10.1186/1755-8794-1-56
Searching for molecular markers in head and neck squamous cell carcinomas (HNSCC) by statistical and bioinformatic analysis of larynx-derived SAGE libraries
Abstract
Background: Head and neck squamous cell carcinoma (HNSCC) is one of the most common malignancies in humans. The average 5-year survival rate is one of the lowest among aggressive cancers, showing no significant improvement in recent years. When detected early, HNSCC has a good prognosis, but most patients present metastatic disease at the time of diagnosis, which significantly reduces survival rate. Despite extensive research, no molecular markers are currently available for diagnostic or prognostic purposes.
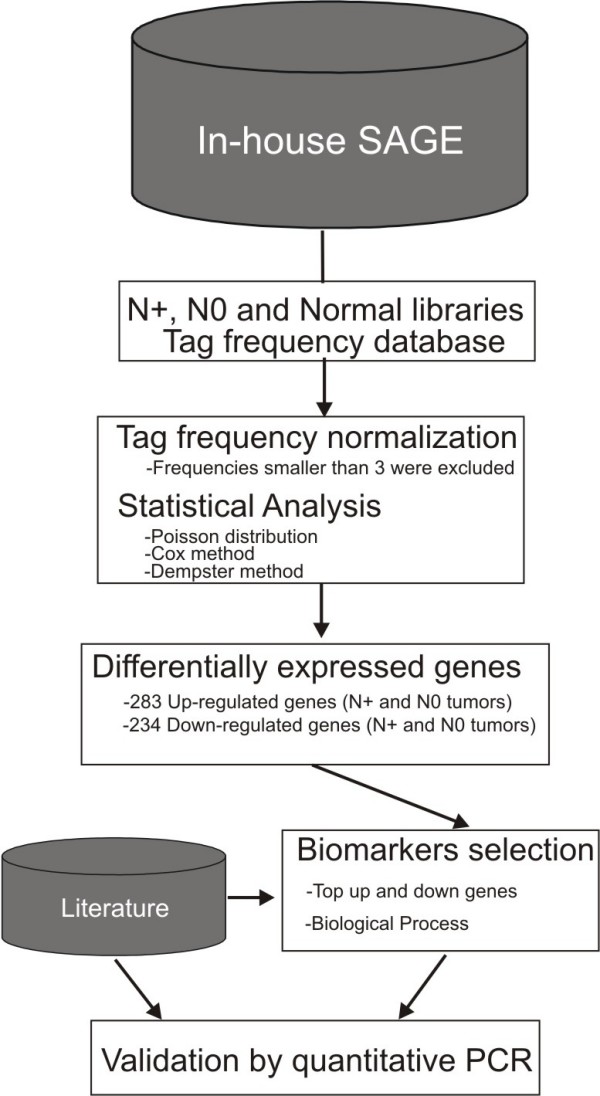
Methods: Aiming to identify differentially-expressed genes involved in laryngeal squamous cell carcinoma (LSCC) development and progression, we generated individual Serial Analysis of Gene Expression (SAGE) libraries from a metastatic and non-metastatic larynx carcinoma, as well as from a normal larynx mucosa sample. Approximately 54,000 unique tags were sequenced in three libraries.
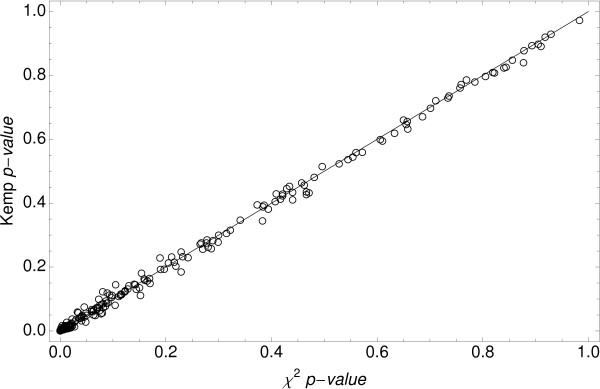
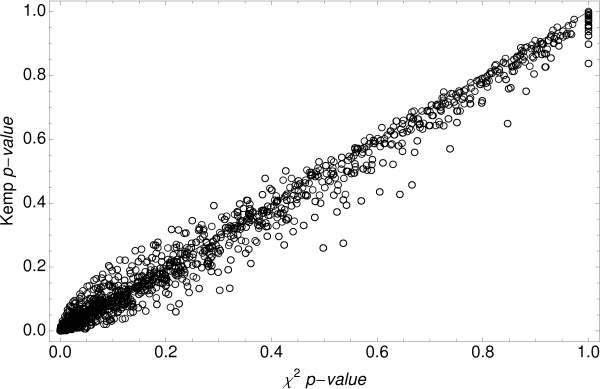
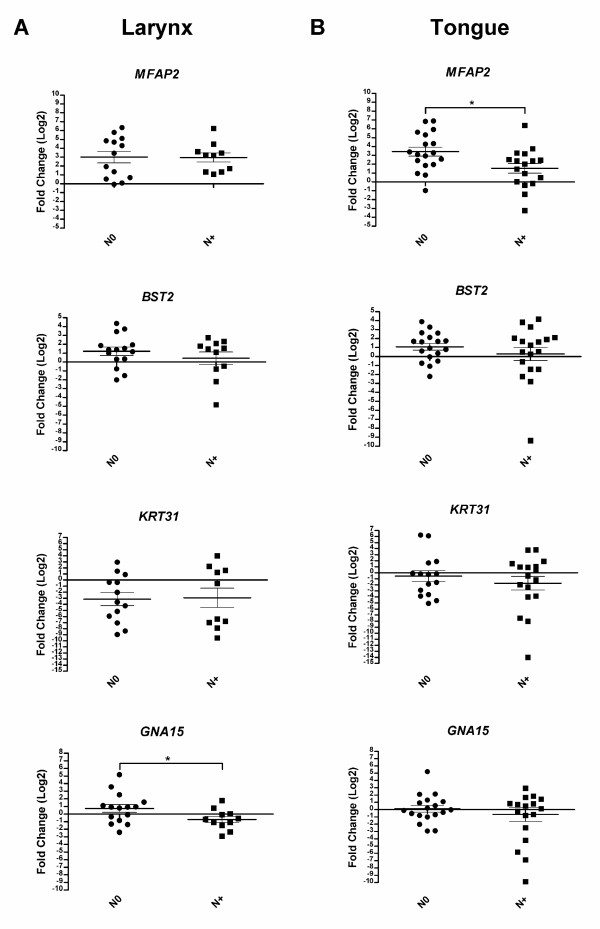
Results: Statistical data analysis identified a subset of 1,216 differentially expressed tags between tumor and normal libraries, and 894 differentially expressed tags between metastatic and non-metastatic carcinomas. Three genes displaying differential regulation, one down-regulated (KRT31) and two up-regulated (BST2, MFAP2), as well as one with a non-significant differential expression pattern (GNA15) in our SAGE data were selected for real-time polymerase chain reaction (PCR) in a set of HNSCC samples. Consistent with our statistical analysis, quantitative PCR confirmed the upregulation of BST2 and MFAP2 and the downregulation of KRT31 when samples of HNSCC were compared to tumor-free surgical margins. As expected, GNA15 presented a non-significant differential expression pattern when tumor samples were compared to normal tissues.
Conclusion: To the best of our knowledge, this is the first study reporting SAGE data in head and neck squamous cell tumors. Statistical analysis was effective in identifying differentially expressed genes reportedly involved in cancer development. The differential expression of a subset of genes was confirmed in additional larynx carcinoma samples and in carcinomas from a distinct head and neck subsite. This result suggests the existence of potential common biomarkers for prognosis and targeted-therapy development in this heterogeneous type of tumor.
Figures
References
-
- Parkin DM, Bray F, Ferlay J, Pisani P. Global cancer statistics, 2002. CA Cancer J Clin. 2005;55:74–108. - PubMed
-
- Brasil . Rio de Janeiro: Ministério da Saúde Secretaria de Atenção à Saúde. Instituto Nacional do Câncer; 2007. Estimativa 2008: Incidência de Câncer no Brasil.
-
- Greenlee RT, Hill-Harmon MB, Murray T, Thun M. Cancer statistics, 2001. CA Cancer J Clin. 2001;51:15–36. - PubMed
LinkOut - more resources
Full Text Sources
Molecular Biology Databases
Research Materials
