. 2008 Nov 13:5:16.
doi: 10.1186/1743-8977-5-16.

IL-1beta differently involved in IL-8 and FGF-2 release in crystalline silica-treated lung cell co-cultures

Affiliations

IL-1beta differently involved in IL-8 and FGF-2 release in crystalline silica-treated lung cell co-cultures

Jan I Herseth et al. Part Fibre Toxicol. .

Abstract

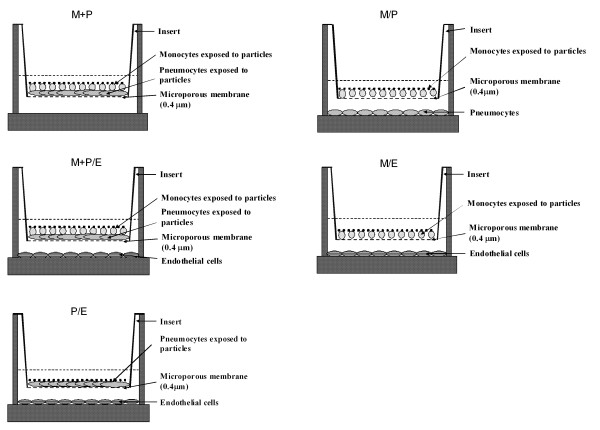
Background: Inhalation of crystalline silica particles is in humans associated with inflammation and development of fibrosis. The aim of the present study was to investigate the effect of crystalline silica on the release of the fibrosis- and angiogenesis-related mediator FGF-2 and the pro-inflammatory mediator IL-8, and how IL-1beta and TNF-alpha were involved in this release from various mono- and co-cultures of monocytes, pneumocytes and endothelial cells.

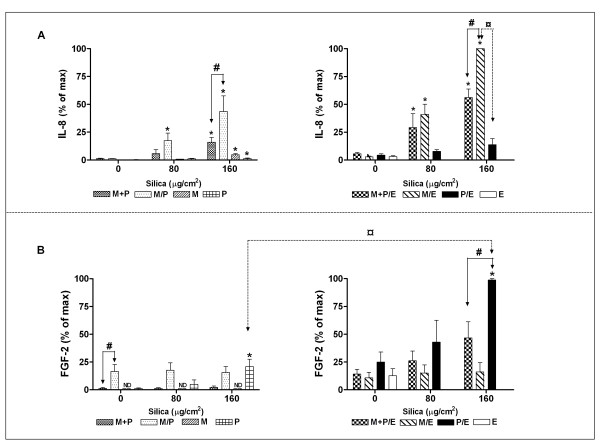
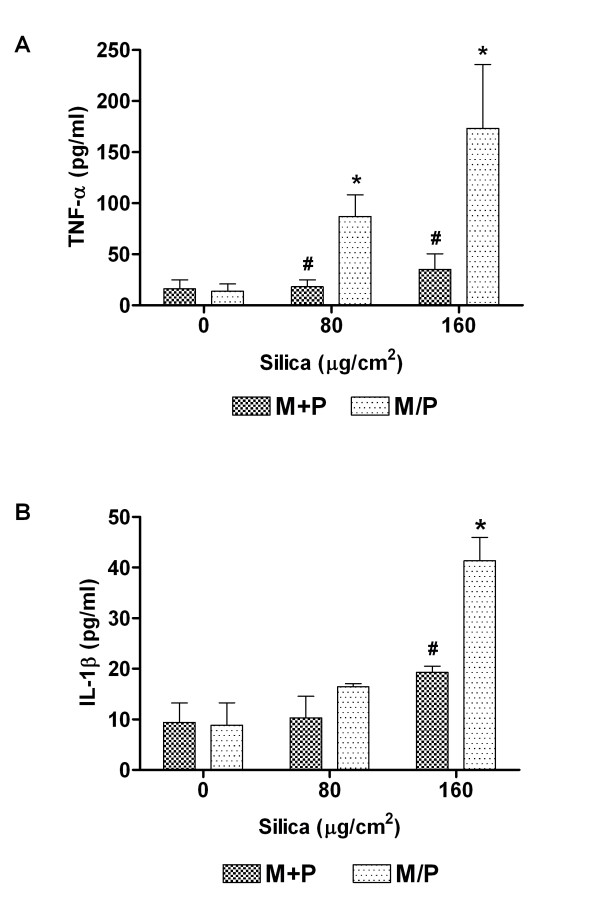
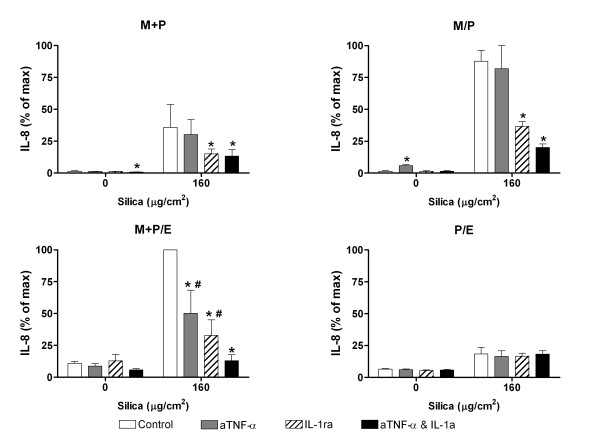
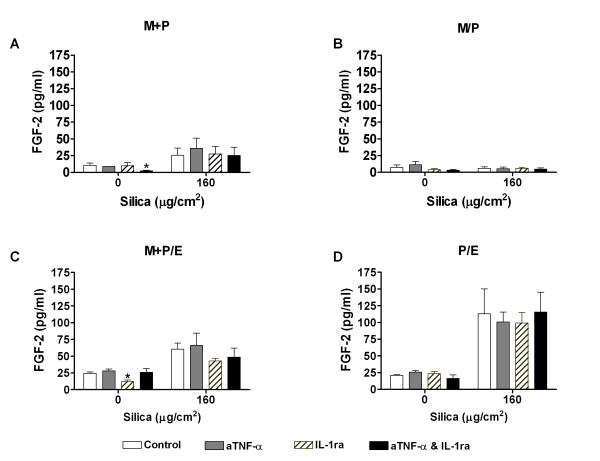
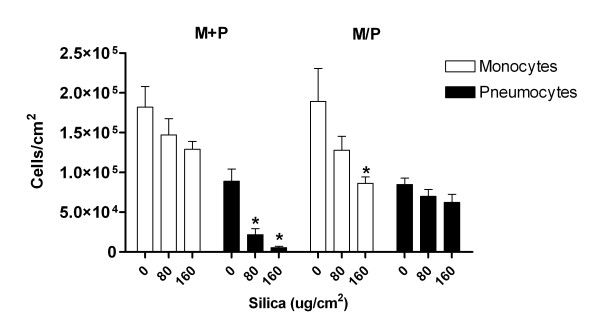
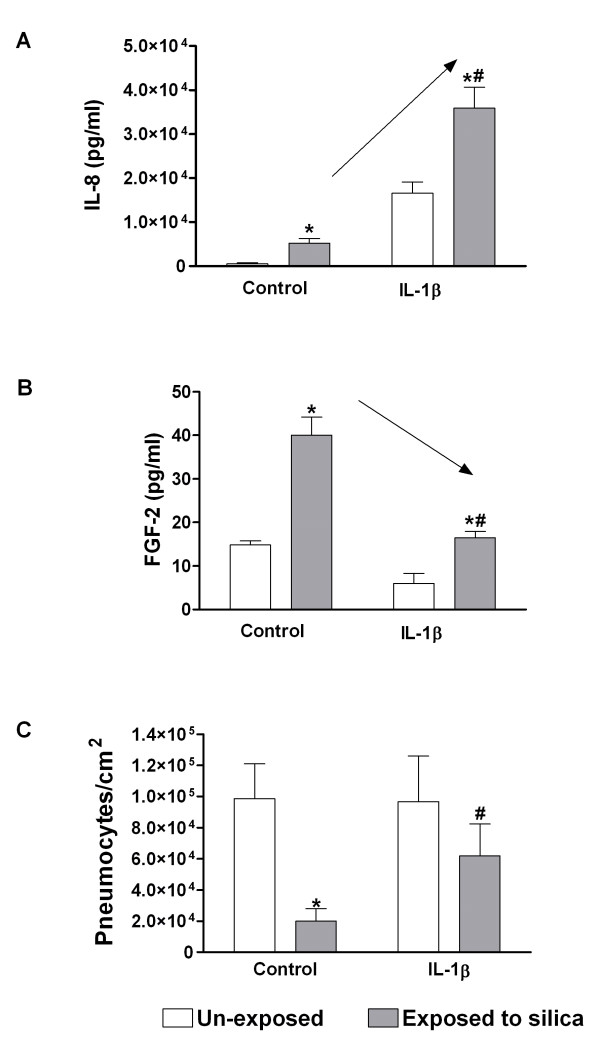
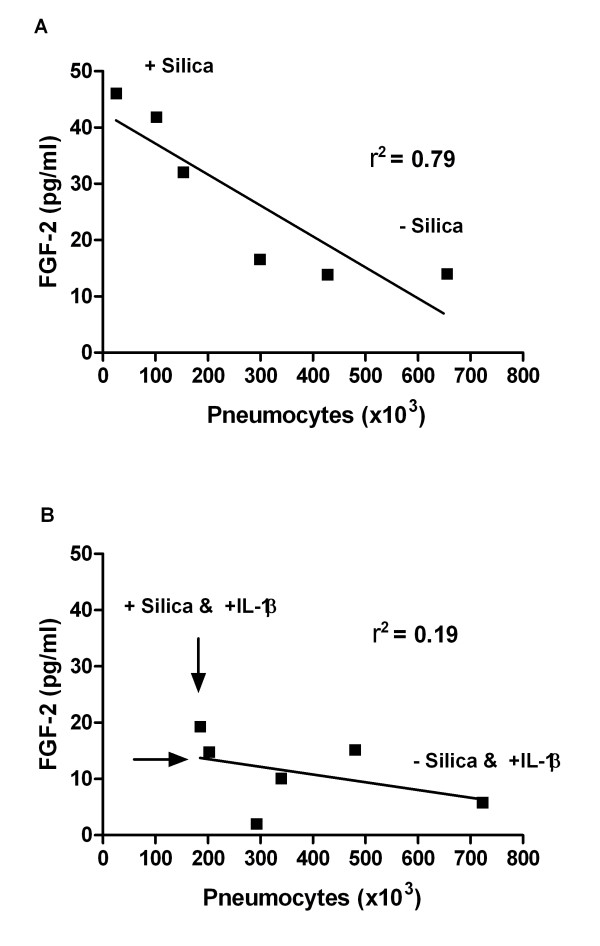
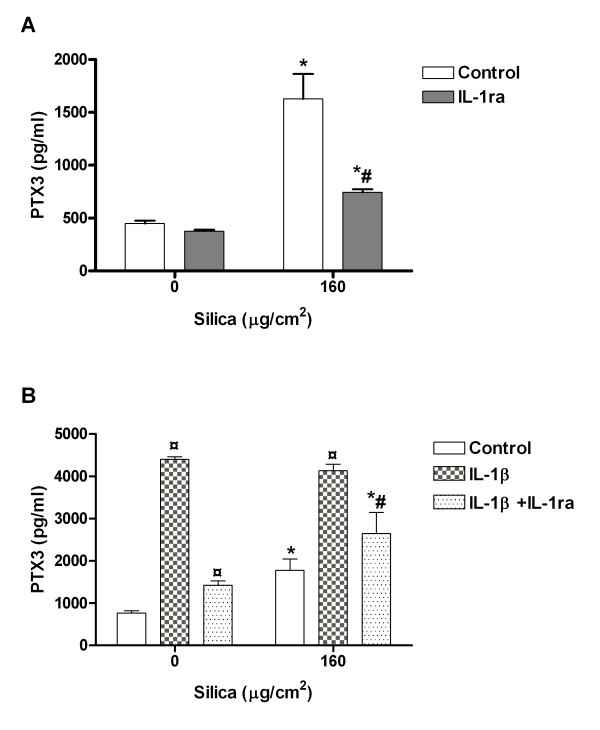
Results: Silica exposure induced an increase of IL-8 release from monocytes and from pneumocytes alone, and the FGF-2 level in the medium increased upon silica exposure of pneumocytes. Both the responses were enhanced in non-contact co-cultures with endothelial cells. The FGF-2 release seemed to increase with the silica-induced decrease in the number of pneumocytes. The release of IL-8 and FGF-2 was partially suppressed in cultures with pneumocytes in contact with monocytes compared to non-contact cultures. Treatment with anti-TNF-alpha and the IL-1 receptor antagonist revealed that release of IL-1beta, and not TNF-alpha, from monocytes dominated the regulation of IL-8 release in co-cultures. For release of FGF-2, IL-1ra was without effect. However, exogenous IL-1beta reduced the FGF-2 levels, strongly elevated the FGF-2-binding protein PTX3, and prevented the reduction in the number of pneumocytes induced by silica.

Conclusion: IL-1beta seems to be differently involved in the silica-induced release of IL-8 and FGF-2 in different lung cell cultures. Whereas the silica-induced IL-8 release is regulated via an IL-1-receptor-mediated mechanism, IL-1beta is suggested only indirectly to affect the silica-induced FGF-2 release by counteracting pneumocyte loss. Furthermore, the enhanced IL-8 and FGF-2 responses in co-cultures involving endothelial cells show the importance of the interaction between different cell types and may suggest that both these mediators are important in angiogenic or fibrogenic processes.


Figures

Figure 1
Figure 1
The figure shows how monocytes (M), pneumocytes (P) and endothelial cells (E) in different co-cultures are distributed into compartments.
Figure 2
Figure 2
The release of IL-8 and FGF-2 from monocultures and co-cultures of monocytes (M), pneumocytes (P) and/or endothelial cells (E). The cells were combined into non-contact co-cultures (M/P, M/E, and P/E) and contact co-cultures (M+P and M+P/E), and exposed to silica (80 and 160 μg/cm2) for 43 h. A: IL-8 (mean of max ± SE = 110583 ± 31940 pg/ml). B: FGF-2 (mean of max ± SE = 269 ± 134 pg/ml). ND = not detected. Data represent means ± SE for n = 4 – 5 separate experiments. *P < 0.05 shows statistical differences of exposed cultures vs. controls. #P < 0.05 shows statistical differences of exposed non-contact co-cultures vs. contact co-cultures. ¤P < 0.05 in A shows statistical differences of exposed non-contact M/E vs. P/E co-cultures, and in B shows statistical differences of exposed non-contact co-cultures of P/E vs. P. Data for IL-8 were log-transformed before performing ANOVA.
Figure 3
Figure 3
The release of TNF-α and IL-1β in contact co-cultures (M+P) and non-contact co-cultures (M/P). The co-cultures were exposed to silica (80 and 160 μg/cm2) for 43 h. Data represent means ± SE for n = 3 separate experiments. *P < 0.05 shows statistical differences of exposed co-cultures vs. control co-cultures. #P < 0.05 shows statistical differences of exposed contact co-cultures vs. exposed non-contact co-cultures. Data were log-transformed before performing ANOVA.
Figure 4
Figure 4
The effect of anti-TNF-α (aTNF-α) and/or IL-1 receptor antagonist (IL-1ra) on IL-8 release. The contact and non-contact co-cultures (M+P, M/P, M+P/E and P/E) were exposed to silica (160 μg/cm2) for 43 h. Contact is symbolised by "+" and non-contact by "/". Data represent means ± SE for n = 3 separate experiments. Mean of max ± SE = 27177 ± 1249 pg/ml. *P < 0.05 shows statistical differences of co-cultures pre-treated with anti-TNF-α and/or IL-1ra vs. untreated co-cultures. #P < 0.05 shows statistical differences of co-cultures pre-treated with anti-TNF-α or IL-1ra alone vs. co-cultures pre-treated with anti-TNF-α and IL-1ra in combination. Data were log-transformed before performing ANOVA.
Figure 5
Figure 5
The effect of anti-TNF-α (aTNF-α) and/or IL-1 receptor antagonist (IL-1ra) on FGF-2 release. The contact and non-contact co-cultures (M+P, M/P, M+P/E and P/E) were exposed to silica (160 μg/cm2) for 43 h. Contact is symbolised by "+" and non-contact by "/". Data represent means ± SE for n = 3 separate experiments. *P < 0.05 shows statistical differences of co-cultures pre-treated with anti-TNF-α and/or IL-1ra vs. untreated co-cultures. #P < 0.05 shows statistical differences of co-cultures pre-treated with anti-TNF-α or IL-1ra alone vs. co-cultures pre-treated with anti-TNF-α and IL-1ra in combination. Data were log-transformed before performing ANOVA.
Figure 6
Figure 6
Silica-induced changes in numbers of monocytes and pneumocytes in contact co-cultures (M+P) and non-contact co-cultures (M/P). The co-cultures were exposed to silica (80 and 160 μg/cm2) for 43 h. Data represent means ± SE for n = 3 separate experiments. *P < 0.05 shows statistical differences of monocytes and pneumocytes in co-cultures exposed to silica vs. un-exposed co-cultures of these cells. Data were log-transformed before performing ANOVA.
Figure 7
Figure 7
The effect of exogenous IL-1β on release of IL-8 (A) and FGF-2 (B) and on number of pneumocytes (C). The contact co-cultures (M+P) were exposed to silica (160 μg/cm2) for 43 h. IL-1β (75 pg/ml) was added to the M+P co-culture 30 min before silica exposure. Data represent means ± SE for n = 3 – 4 separate experiments. *P < 0.05 shows statistical differences of silica-exposed co-cultures vs. un-exposed controls. #P < 0.05 shows statistical differences of co-cultures exposed to silica vs. co-cultures given IL-1β before silica exposure. Arrows (A, B) indicate the direction of changes by exogenous IL-1β. Data for IL-8 and number of pneumocytes were log-transformed before performing ANOVA.
Figure 8
Figure 8
The figure shows the correlation between changes in number of pneumocytes and FGF-2 release. These changes were measured in un-exposed and silica-exposed contact co-cultures (M+P) without (A) and with IL-1β supply (B). The IL-1β (75 pg/ml) was added to the contact co-cultures 30 min before silica exposure (160 μg/cm2). The time of exposure was 43 h. Data are from 3 separate experiments. A high r2 indicates a good correlation. The slope was only significantly different from zero in figure A (P = 0.0183). Arrows (B) indicate the directions of changes (e.g. increased cell number and decreased release of FGF-2). Univariate linear regression and correlation analysis were used to assess if cell number could explain the changes in release of FGF-2.
Figure 9
Figure 9
The effect of IL-1ra (A) and/or exogenous IL-1β (B) on the release of PTX3 in contact co-cultures (M+P). The co-cultures were exposed to silica (160 μg/cm2) for 43 h. IL-1β (75 pg/ml) was added to the M+P co-culture with or without IL-1ra 30 min before silica exposure. Data represent means ± SE for n = 3 separate experiments. *P < 0.05 shows statistical differences of exposed co-cultures vs. un-exposed controls. #P < 0.05 shows statistical differences of exposed co-cultures treated with IL-1ra vs. exposed co-cultures without treatment. ¤P < 0.05 shows statistical differences of IL-1β-treated co-cultures vs. un-treated co-cultures. Data were log-transformed before performing ANOVA.

References

    1. Fubini B, Hubbard A. Reactive oxygen species (ROS) and reactive nitrogen species (RNS) generation by silica in inflammation and fibrosis. Free Radic Biol Med. 2003;34:1507–1516. doi: 10.1016/S0891-5849(03)00149-7. - DOI - PubMed
    1. Davis GS. Pathogenesis of silicosis: current concepts and hypotheses. Lung. 1986;164:139–154. doi: 10.1007/BF02713638. - DOI - PubMed
    1. Rimal B, Greenberg AK, Rom WN. Basic pathogenetic mechanisms in silicosis: current understanding. Curr Opin Pulm Med. 2005;11:169–173. doi: 10.1097/01.mcp.0000152998.11335.24. - DOI - PubMed
    1. Davis GS, Pfeiffer LM, Hemenway DR. Persistent overexpression of interleukin-1beta and tumor necrosis factor-alpha in murine silicosis. J Environ Pathol Toxicol Oncol. 1998;17:99–114. - PubMed
    1. Driscoll KE, Carter JM, Hassenbein DG, Howard B. Cytokines and particle-induced inflammatory cell recruitment. Environ Health Perspect. 1997;105:1159–1164. doi: 10.2307/3433526. - DOI - PMC - PubMed

LinkOut - more resources