

Natural selection governs local, but not global, evolutionary gene coexpression networks in Caenorhabditis elegans
- PMID: 19014554
- PMCID: PMC2596099
- DOI: 10.1186/1752-0509-2-96
Natural selection governs local, but not global, evolutionary gene coexpression networks in Caenorhabditis elegans
Abstract
Background: Large-scale evaluation of gene expression variation among Caenorhabditis elegans lines that have diverged from a common ancestor allows for the analysis of a novel class of biological networks - evolutionary gene coexpression networks. Comparative analysis of these evolutionary networks has the potential to uncover the effects of natural selection in shaping coexpression network topologies since C. elegans mutation accumulation (MA) lines evolve essentially free from the effects of natural selection, whereas natural isolate (NI) populations are subject to selective constraints.
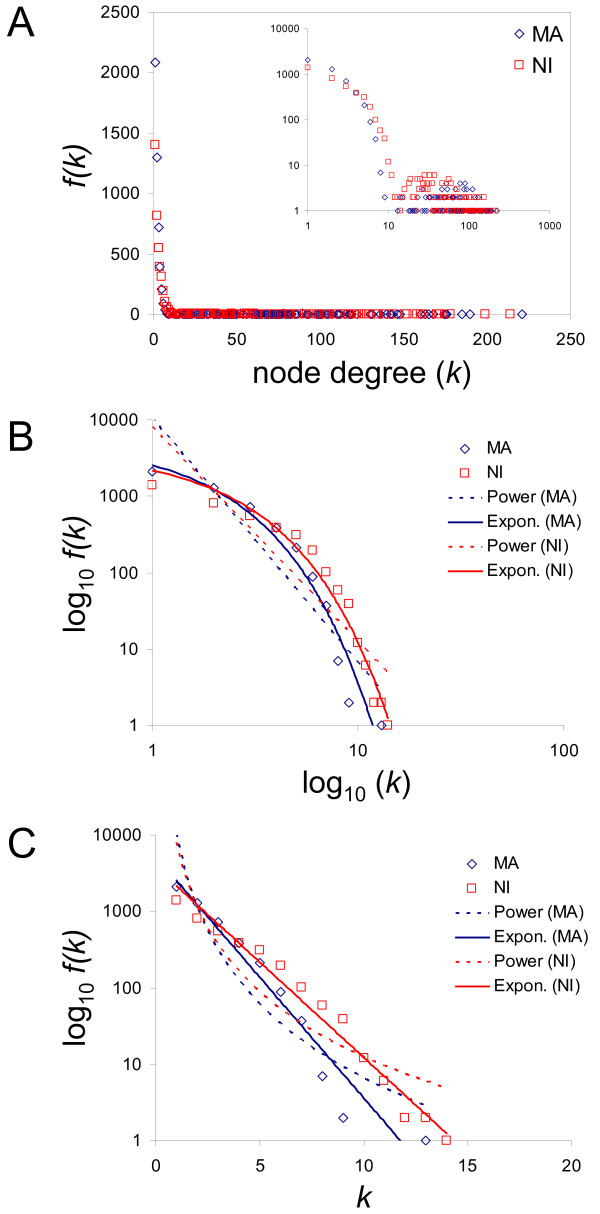
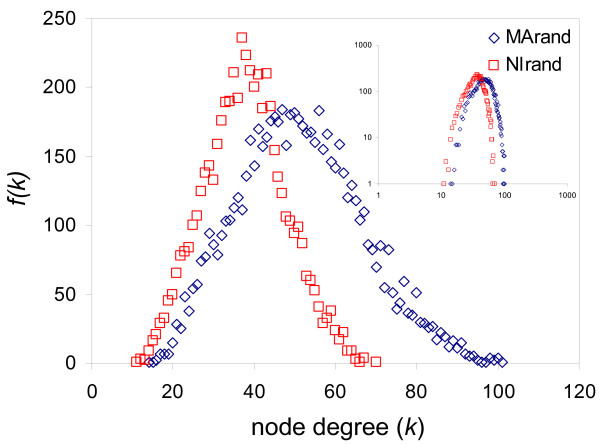
Results: We compared evolutionary gene coexpression networks for C. elegans MA lines versus NI populations to evaluate the role that natural selection plays in shaping the evolution of network topologies. MA and NI evolutionary gene coexpression networks were found to have very similar global topological properties as measured by a number of network topological parameters. Observed MA and NI networks show node degree distributions and average values for node degree, clustering coefficient, path length, eccentricity and betweeness that are statistically indistinguishable from one another yet highly distinct from randomly simulated networks. On the other hand, at the local level the MA and NI coexpression networks are highly divergent; pairs of genes coexpressed in the MA versus NI lines are almost entirely different as are the connectivity and clustering properties of individual genes.
Conclusion: It appears that selective forces shape how local patterns of coexpression change over time but do not control the global topology of C. elegans evolutionary gene coexpression networks. These results have implications for the evolutionary significance of global network topologies, which are known to be conserved across disparate complex systems.
Figures


Similar articles
-
The transcriptional consequences of mutation and natural selection in Caenorhabditis elegans.Nat Genet. 2005 May;37(5):544-8. doi: 10.1038/ng1554. Epub 2005 Apr 24. Nat Genet. 2005. PMID: 15852004
-
Global similarity and local divergence in human and mouse gene co-expression networks.BMC Evol Biol. 2006 Sep 12;6:70. doi: 10.1186/1471-2148-6-70. BMC Evol Biol. 2006. PMID: 16968540 Free PMC article.
-
A gene-coexpression network for global discovery of conserved genetic modules.Science. 2003 Oct 10;302(5643):249-55. doi: 10.1126/science.1087447. Epub 2003 Aug 21. Science. 2003. PMID: 12934013
-
C. elegans network biology: a beginning.WormBook. 2006 Aug 21:1-20. doi: 10.1895/wormbook.1.118.1. WormBook. 2006. PMID: 18050437 Free PMC article. Review.
-
Molecular evolution inferences from the C. elegans genome.WormBook. 2010 Mar 5:1-14. doi: 10.1895/wormbook.1.149.1. WormBook. 2010. PMID: 20213859 Review.
Cited by
-
The structure of a gene co-expression network reveals biological functions underlying eQTLs.PLoS One. 2013;8(4):e60045. doi: 10.1371/journal.pone.0060045. Epub 2013 Apr 5. PLoS One. 2013. PMID: 23577081 Free PMC article.
-
Are there laws of genome evolution?PLoS Comput Biol. 2011 Aug;7(8):e1002173. doi: 10.1371/journal.pcbi.1002173. Epub 2011 Aug 25. PLoS Comput Biol. 2011. PMID: 21901087 Free PMC article.
-
Systems-based analysis of the Sarcocystis neurona genome identifies pathways that contribute to a heteroxenous life cycle.mBio. 2015 Feb 10;6(1):e02445-14. doi: 10.1128/mBio.02445-14. mBio. 2015. PMID: 25670772 Free PMC article.
-
Constraints and plasticity in genome and molecular-phenome evolution.Nat Rev Genet. 2010 Jul;11(7):487-98. doi: 10.1038/nrg2810. Nat Rev Genet. 2010. PMID: 20548290 Free PMC article. Review.
-
Evolution of protein-protein interaction networks in yeast.PLoS One. 2017 Mar 1;12(3):e0171920. doi: 10.1371/journal.pone.0171920. eCollection 2017. PLoS One. 2017. PMID: 28248977 Free PMC article.
References
Publication types
MeSH terms
LinkOut - more resources
Full Text Sources
