

Plasma Pentraxin3 is a novel marker for nonalcoholic steatohepatitis (NASH)
- PMID: 19014569
- PMCID: PMC2621235
- DOI: 10.1186/1471-230X-8-53
Plasma Pentraxin3 is a novel marker for nonalcoholic steatohepatitis (NASH)
Abstract
Background: The changes in the liver in nonalcoholic fatty liver disease (NAFLD) range over a wide spectrum, extending from steatosis to steatohepatitis (NASH). However it has remained difficult to differentiate between NASH and non-progressive NAFLD on the basis of the clinical findings alone.
Aims: In this study we investigated the clinical usefulness of plasma Pentraxin3 (PTX3) levels to predict NASH. Plasma PTX3 was measured in 70 patients with histologically verified NAFLD (28 with non-NASH and 42 with NASH) and 10 healthy control subjects.
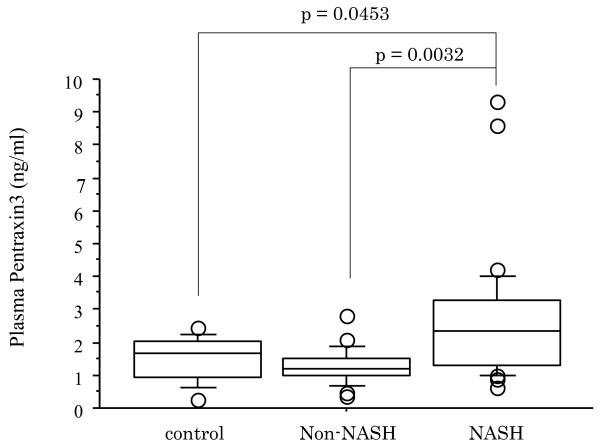
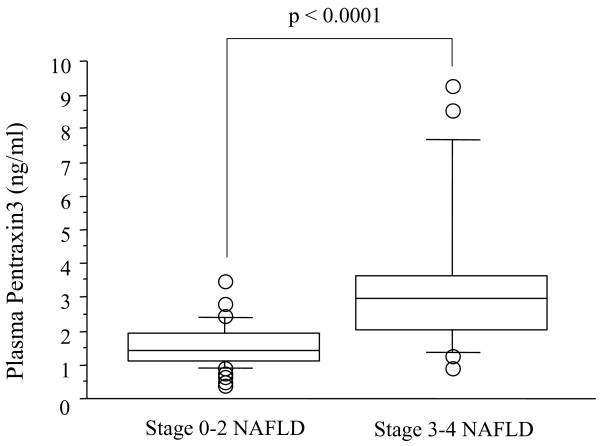
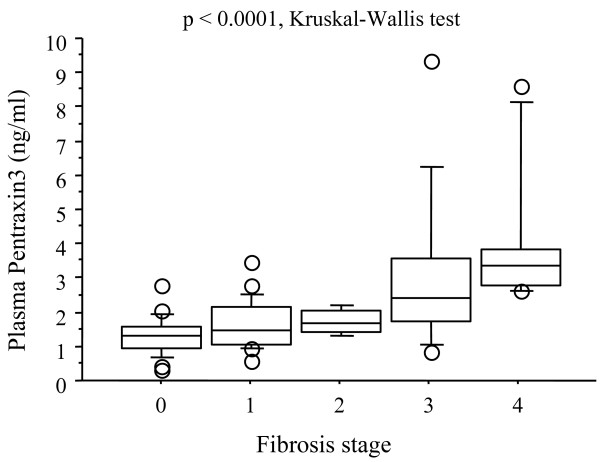
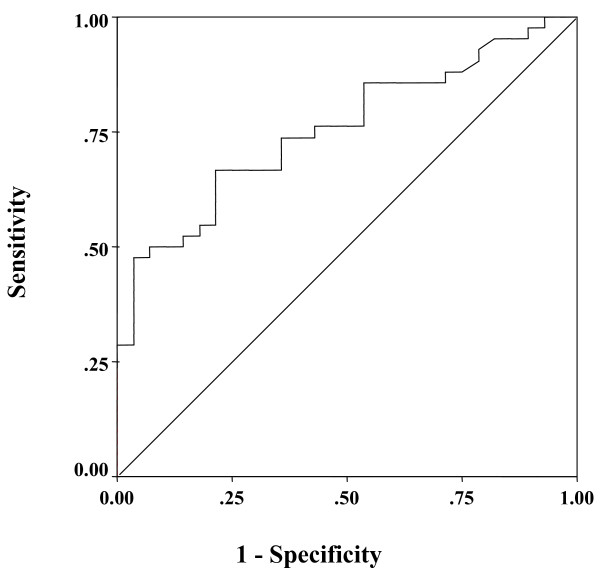
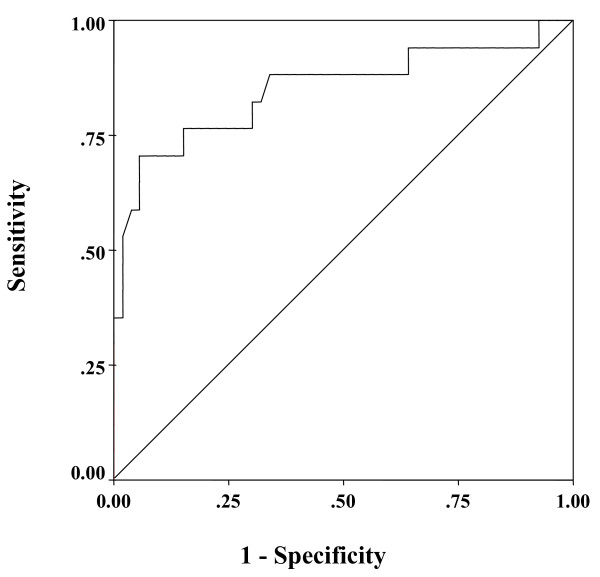
Results: The plasma PTX3 level was significantly higher in the NASH cases than in the non-NASH cases (p = 0.0021) and control subjects (p = 0.045). And the plasma PTX3 level was significantly higher in the stages 3-4 NAFLD cases than in the stages 0-2 NAFLD cases (p < 0.0001). The PTX3 values were closely correlated with the stages of liver fibrosis (p < 0.0001, Kruskal-Wallis test). To detect NASH compared with non-NASH, the area under the curve for plasma PTX3 were 0.755, and to detect stages 3-4 NAFLD compared with stages 0-2 NAFLD, the area under the curve for plasma PTX3 were 0.850.
Conclusion: This is the first study to demonstrate consistent and profound elevation of plasma PTX3 levels in NASH in comparison with non-NASH. The results suggest that plasma PTX3 levels may not only be laboratory values that differentiate NASH from non-NASH, but marker of the severity of hepatic fibrosis in NASH.
Figures
References
-
- Angulo P. Nonalcoholic fatty liver disease. N Engl J Med. 2002;18:1221–31. - PubMed
-
- Farrell GC. Non-alcoholic steatohepatitis: what is it, and why is it important in the Asia-Pacific region? J Gastroenterol Hepatol. 2003;18:124–38. - PubMed
-
- Diehl AM, Goodman Z, Ishak KG. Alcohollike liver disease in nonalcoholics. A clinical and histologic comparison with alcohol-induced liver injury. Gastroenterology. 1988;95:1056–62. - PubMed
-
- Ludwig J, Viggiano TR, McGill DB, Oh BJ. Nonalcoholic steatohepatitis: Mayo Clinic experiences with a hitherto unnamed disease. Mayo Clin Proc. 1980;55:434–8. - PubMed
-
- Angulo P, Keach JC, Batts KP, Lindor KD. Independent predictors of liver fibrosis in patients with nonalcoholic steatohepatitis. Hepatology. 1999;30:1356–62. - PubMed
Publication types
MeSH terms
Substances
LinkOut - more resources
Full Text Sources
Other Literature Sources
Medical
Miscellaneous
