. 2008 Nov;10(11):726-38.
doi: 10.1007/s12094-008-0279-5.

Identification of the Rock-dependent transcriptome in rodent fibroblasts

Affiliations

Identification of the Rock-dependent transcriptome in rodent fibroblasts

Inmaculada M Berenjeno et al. Clin Transl Oncol. 2008 Nov.

Abstract

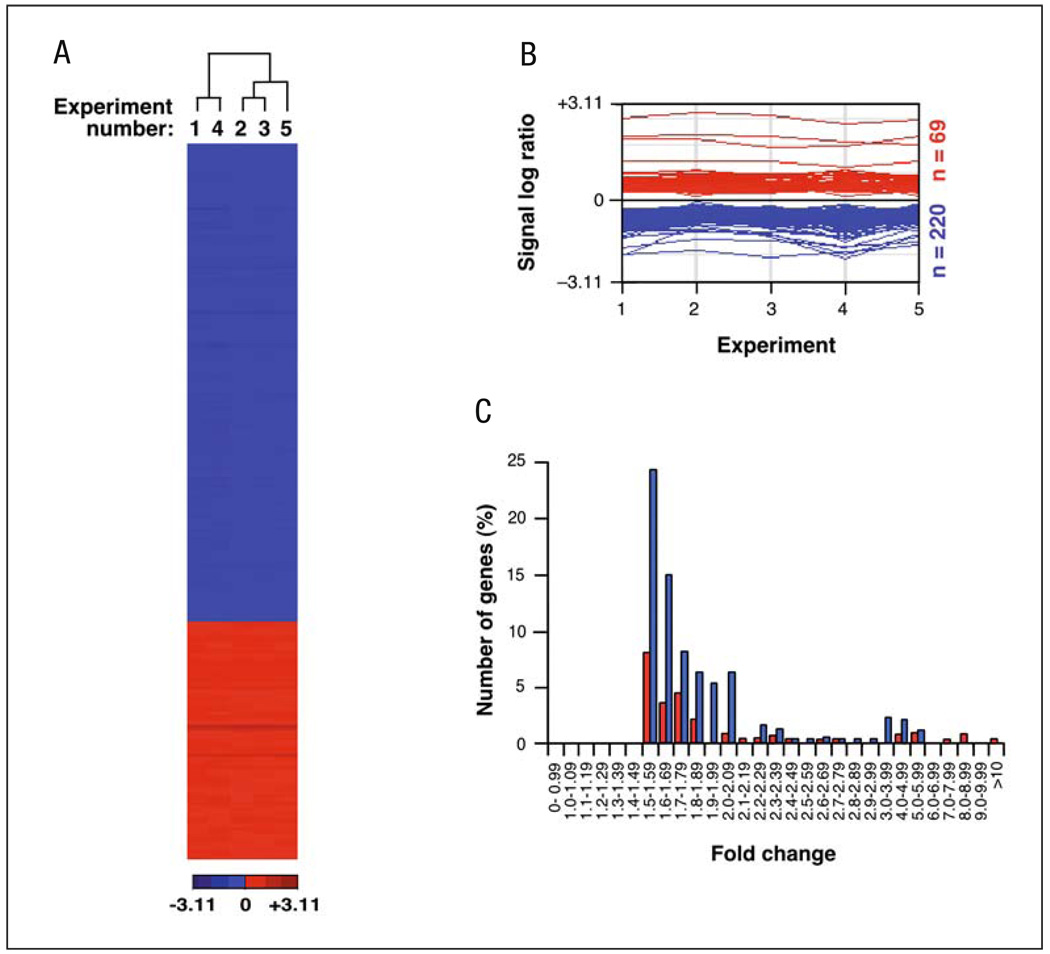
Rock proteins are Rho GTPase-dependent serine/ threonine kinases with crucial roles in F-actin dynamics and cell transformation. By analogy with other protein kinase families, it can be assumed that Rock proteins act, at least in part, through the regulation of gene expression events. However, with the exception of some singular transcriptional targets recently identified, the actual impact of these kinases on the overall cell transcriptome remains unknown. To address this issue, we have used a microarray approach to compare the transcriptomes of exponentially growing NIH3T3 cells that had been untreated or treated with Y27632, a well known specific inhibitor for Rock kinase activity. We show here that the Rock pathway promotes a weak impact on the fibroblast transcriptome, since its inhibition only results in changes in the expression of 2.3% of all the genes surveyed in the microarrays. Most Y27632-dependent genes are downregulated at moderate levels, indicating that the Rock pathway predominantly induces the upregulation of transcriptionally active genes. Although functionally diverse, a common functional leitmotiv of Y27632-dependent genes is the implication of their protein products in cytoskeletal-dependent processes. Taken together, these results indicate that Rock proteins can modify cytoskeletal dynamics by acting at post-transcriptional and transcriptional levels. In addition, they suggest that the main target of these serine/threonine kinases is the phosphoproteome and not the transcriptome.


Figures

Fig. 1
Fig. 1
Transcriptomal changes induced by Y27632 in exponentially growing NIH3T3 cells. A Hierarchical cluster diagram of the 289 genes whose expression levels changed in Y27632-treated cells. Each column represents one experiment and each row a gene. Varying levels of expression are represented on a scale from dark blue (lowest expression) to dark red (highest expression). Note that expression values are represented as signal log ratio numbers (SLR) and that, therefore, the total fold change value is obtained from 2SLR. The experiment number is shown at the top of each column. B Gene graphs showing the induced (red) and repressed (blue) genes in Y27632-treated cells. In each category, the expression values of all deregulated genes are represented as SLR (considering that fold change is 2SLR; y-axis) obtained in each experimental sample (x-axis). The total number of upregulated and downregulated genes in each category is indicated on the right of each panel. C Histogram showing the number of up- (red) and downregulated (blue) genes with a given expression fold change value in Y27632-treated cells
Fig. 2
Fig. 2
Corroboration of Affymetrix data by quantitative RT-PCR. A, B Expression levels of the indicated up-regulated (A) and downregulated (B) mRNAs by the Y27632 treatment were determined by either microarray (A, grey bars) or quantitative RT-PCR (Q, black bars). Values are expressed as fold change of the appropriate gene with respect to the transcript levels found in untreated NIH3T3 cells
Fig. 3
Fig. 3
Functional annotation and characterisation of Y27632-dependent genes. A Classification of up- (red) and downregulated (blue) genes by the Y27632 treatment according to general biological functions. BD The molecular networks identified using the Ingenuity database in the Y27632-affected transcriptome. Nodes are colour-coded in red (upregulated) or green (downregulated) according to their fold change values
Fig. 4
Fig. 4
Corroboration of the molecular networks identified in Fig. 3 by quantitative RT-PCR. AC RT-PCR-determined expression levels of selected genes belonging to the molecular networks shown in Fig. 3B (A), 3C (B) and 3D (C). Values are expressed as fold change of the appropriate gene with respect to the transcript levels found in untreated NIH3T3 cells

References

    1. Bustelo XR, Sauzeau V, Berenjeno IM. GTP-binding proteins of the Rho/Rac family: regulation, effectors and functions in vivo. Bioessays. 2007 Apr;29:356–370. - PMC - PubMed
    1. Van Aelst L, D'Souza-Schorey C. Rho GTPases and signaling networks. Genes Dev. 1997;11:2295–2322. - PubMed
    1. Symons M, Rusk N. Control of vesicular trafficking by Rho GTPases. Curr Biol. 2003;13:R409–R418. - PubMed
    1. Etienne-Manneville S, Hall A. Rho GTPases in cell biology. Nature. 2002;420:629–635. - PubMed
    1. Coleman ML, Marshall CJ, Olson MF. RAS and RHO GTPases in G1-phase cell-cycle regulation. Nat Rev Mol Cell Biol. 2004;5:355–366. - PubMed

Publication types

MeSH terms

Associated data