

Predicting adult metabolic syndrome from childhood body mass index: follow-up of the New Delhi birth cohort
- PMID: 19015213
- PMCID: PMC2749731
- DOI: 10.1136/adc.2008.140905
Predicting adult metabolic syndrome from childhood body mass index: follow-up of the New Delhi birth cohort
Abstract
Objectives: To assess whether serial measurements of childhood body mass index (BMI) give clinically useful predictions of the risk of developing adult metabolic syndrome and impaired glucose tolerance or type 2 diabetes.
Design/setting: Follow-up of a community-based birth cohort in Delhi, India.
Participants: 1492 men and women aged 26-32 years whose BMI was recorded 6-monthly throughout childhood.
Main outcome measures: The predictive value of childhood BMI for adult metabolic syndrome and impaired glucose tolerance (IGT) and diabetes mellitus.
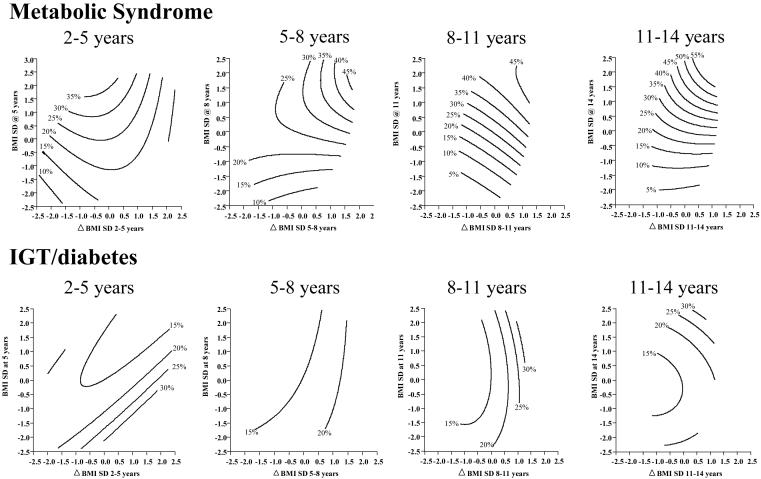
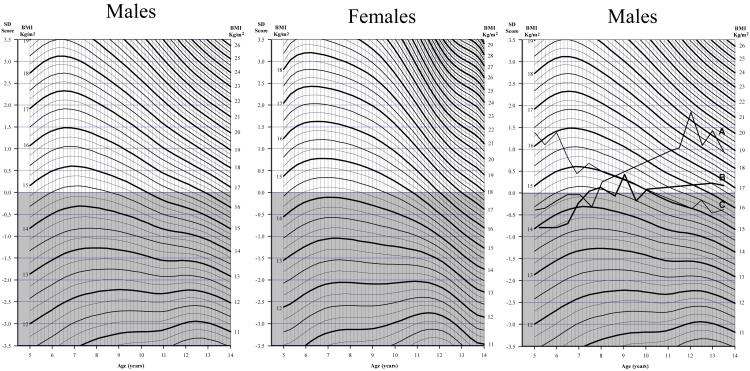
Results: 25% of subjects had metabolic syndrome and 15% had IGT/diabetes mellitus. Both outcomes were associated with greater childhood BMI gain (metabolic syndrome: OR 1.63 (95% CI 1.44 to 1.85); IGT/diabetes mellitus: 1.39 (1.20 to 1.60) per unit increase in within-cohort BMI SD score between 5 and 14 years). The best predictions of adult disease were obtained using a combined test comprising (i) any increase in BMI SD score between 5 and 14 years and (ii) a BMI SD score >0 at 14 years (metabolic syndrome: sensitivity 45%, specificity 78%; IGT/diabetes mellitus: 37%, 73%). Likelihood ratios were low (metabolic syndrome: 1.4-2.0; IGT/diabetes mellitus: 1.2-1.4). A single high BMI measurement at 14 years (overweight or obese, according to International Obesity Task Force criteria) was highly specific but insensitive (metabolic syndrome: sensitivity 7%, specificity 97%; IGT/diabetes mellitus: 8%, 97%). Charts for plotting BMI SD scores through childhood were produced.
Conclusions: Serial measurements of childhood BMI give useful predictions of adult risk and could guide advice to children and parents on preventing later disease.
Figures
References
-
- Wild S, Roglic G, Green A, Sicree R, King H. Global prevalence of diabetes. Estimates for the year 2000 and projections for 2030. Diabetes Care. 2004;27:1047–1053. - PubMed
-
- Srinivasan SR, Myers L, Berenson GS. Predictability of childhood adiposity and insulin for developing insulin resistance syndrome (Syndrome X) in young adulthood; the Bogalusa Heart Study. Diabetes. 2002;51:204–9. - PubMed
-
- Sinaiko AR, Donahue RP, Jacobs DR, Prineas RJ. Relation of weight and rate of increase in weight during childhood and adolescence to body size, blood pressure, fasting insulin and lipids in young adults; the Minneapolis children’s blood pressure study. Circulation. 1999;99:1471–6. - PubMed
Publication types
MeSH terms
Grants and funding
- MC_U147574245/MRC_/Medical Research Council/United Kingdom
- G0400519(71108)/MRC_/Medical Research Council/United Kingdom
- U.1475.00.004.00005.01 (85821)/MRC_/Medical Research Council/United Kingdom
- PG/05/046/18730/BHF_/British Heart Foundation/United Kingdom
- G0400519/MRC_/Medical Research Council/United Kingdom
LinkOut - more resources
Full Text Sources
Medical