. 2009 Jan 16;284(3):1461-73.
doi: 10.1074/jbc.M802298200. Epub 2008 Nov 17.

Nitro-fatty acid metabolome: saturation, desaturation, beta-oxidation, and protein adduction

Affiliations

Nitro-fatty acid metabolome: saturation, desaturation, beta-oxidation, and protein adduction

Volker Rudolph et al. J Biol Chem. .

Abstract

Nitrated derivatives of fatty acids (NO2-FA) are pluripotent cell-signaling mediators that display anti-inflammatory properties. Current understanding of NO2-FA signal transduction lacks insight into how or if NO2-FA are modified or metabolized upon formation or administration in vivo. Here the disposition and metabolism of nitro-9-cis-octadecenoic (18:1-NO2) acid was investigated in plasma and liver after intravenous injection in mice. High performance liquid chromatography-tandem mass spectrometry analysis showed that no 18:1-NO2 or metabolites were detected under basal conditions, whereas administered 18:1-NO2 is rapidly adducted to plasma thiol-containing proteins and glutathione. NO2-FA are also metabolized via beta-oxidation, with high performance liquid chromatography-tandem mass spectrometry analysis of liver lipid extracts of treated mice revealing nitro-7-cis-hexadecenoic acid, nitro-5-cis-tetradecenoic acid, and nitro-3-cis-dodecenoic acid and corresponding coenzyme A derivatives of 18:1-NO2 as metabolites. Additionally, a significant proportion of 18:1-NO2 and its metabolites are converted to nitroalkane derivatives by saturation of the double bond, and to a lesser extent are desaturated to diene derivatives. There was no evidence of the formation of nitrohydroxyl or conjugated ketone derivatives in organs of interest, metabolites expected upon 18:1-NO2 hydration or nitric oxide (*NO) release. Plasma samples from treated mice had significant extents of protein-adducted 18:1-NO2 detected by exchange to added beta-mercaptoethanol. This, coupled with the observation of 18:1-NO2 release from glutathione-18:1-NO2 adducts, supports that reversible and exchangeable NO2-FA-thiol adducts occur under biological conditions. After administration of [3H]18:1-NO2, 64% of net radiolabel was recovered 90 min later in plasma (0.2%), liver (18%), kidney (2%), adipose tissue (2%), muscle (31%), urine (6%), and other tissue compartments, and may include metabolites not yet identified. In aggregate, these findings show that electrophilic FA nitroalkene derivatives (a) acquire an extended half-life by undergoing reversible and exchangeable electrophilic reactions with nucleophilic targets and (b) are metabolized predominantly via saturation of the double bond and beta-oxidation reactions that terminate at the site of acyl-chain nitration.


Figures

FIGURE 1.
FIGURE 1.
Representative example of precursor ion scan of 46 atomic mass units of whole blood samples. Fatty acids were extracted from whole blood samples of mice treated with vehicle (A) or 30 μl of 10 mm 18:1-NO2 (B) using acetonitrile (see “Experimental Procedures” for details). Scan shows precursor ions of 46 atomic mass units corresponding to the mass of formula image and identified peaks.
FIGURE 2.
FIGURE 2.
Metabolic derivatives of 18:1-NO2 in whole blood after intravenous injection. Analysis was performed by HPLC-ESI MS in the MRM scan mode using mass transitions according to the expected differences in molecular masses (Table 1). A, co-elution of profiles for 18:1-NO2 and [13C] 18:1-NO2 and their metabolites. B, profiles for 18:0-NO2, 18:2-NO2, and their respective metabolites. β-Oxidation metabolites for all species could be detected in all treated mice. The smallest detectable metabolites had a chain length of 12 carbon atoms for each species. Each HPLC elution profile is presented with base peak intensity and does not reflect quantity relative to the other profiles.
FIGURE 3.
FIGURE 3.
Identification and structural characterization of 18:1-NO2 and its metabolites by MS/MS analysis. MS/MS analysis was performed for all observed metabolites. Representative examples of each species are shown. The left column displays HPLC elution profiles acquired by MRM monitoring of transitions shown in Table 1. In the right column identifying MS/MS fragmentation patterns, which were used for characterization of the different metabolites, are illustrated. The top panel displays the HPLC elution profile and MS/MS spectrum of the 18:1-NO2-injection solution. Relative intensities are displayed, which do not allow for quantity relative to the other profiles.
FIGURE 4.
FIGURE 4.
Concentrations of 18:1-NO2 and 18:0-NO2 in whole blood over the time course of 90 min after intravenous injection of 18:1-NO2. Venous blood of treated mice was extracted and prepared for mass spectrometric analysis as described under “Experimental Procedures.” Concentrations of 18:1-NO2 were calculated using [13C] 18:1-NO2 as internal standard, which was added during sample preparation to correct for any losses. 18:0-NO2 was quantitated using an external standard curve of nitro-octadecanoic acid, which was linear over four orders of magnitude (0.08–80.00 nm). Top left panel, a two-phase decline of the 18:1-NO2 concentration with the first phase (5–15 min) predominantly reflecting distribution of the compound into extraplasmatic compartments and the second phase (15–90 min) predominantly reflecting elimination. 18:0-NO2 concentration already after 5 min reaches 40% of the concentration of 18:1-NO2 and converges with 18:1-NO2 concentration after 60 min. Values given for β-oxidation metabolites were calculated in relation to the [13C]18:1-NO2 internal standard for the sake of comparability. Comparisons are based upon the assumption that fragmentation efficiencies are similar between metabolites. Values are therefore given as area ratio. Metabolites of nitro-octadecanoic acid exhibited higher values as the corresponding metabolites of 18:1-NO2. However, areas under the curve were not statistically different.
FIGURE 5.
FIGURE 5.
Saturation of 18:1-NO2 to 18:0-NO2 in bovine aortic endothelial cells. Bovine aortic endothelial cells were grown to confluence and treated with HBSS, oleic acid, 18:1-NO2, or [13C]18:1-NO2 over a period of 90 min. A continuous decline in peak area was observed for 18:1-NO2 (A). 18:0-NO2 was detectable first after 15 min. Peak areas for later time points showed a continuous increase (B). C illustrates a representative example the MRM transitions of 18:1-NO2 (326/46) and 18:0-NO2 (328/46). *, marks the peak for 18:0-NO2. An isotopic peak of 18:1-NO2 was observed in the mass transition m/z 328/46, which co-eluted exactly with 18:1-NO2 and showed a decrease over the time course of 90 min.
FIGURE 6.
FIGURE 6.
Identification of NO2-FA species without electrophilic reactivity. The top panel shows the HPLC elution profile for the mass transition m/z 326/46 of 18:1-NO2. Peak 2 represents the characteristic peak of 18:1-NO2. To test for electrophilic reactivity the extracted blood sample, which gave the HPLC elution profile illustrated in panel A, was treated with BME as demonstrated in B. As expected, the characteristic peak of 18:1-NO2 disappeared in the mass transition m/z 326/46 (arrow) and a new peak eluted shortly before (*), whereas peaks 1 and 3 remain unaltered suggesting a lack of electrophilic reactivity. As demonstrated in C this new peak co-eluted with the BME-adducted 18:1-NO2 (*), which can be explained by partial in-source fragmentation of the BME-adducts resulting in the release of the free fatty acid ion, which then is detectable in its actual mass transition m/z 326/46. D and E illustrate HPLC elution profiles of free and BME-adducted [13C]18:1-NO2. Although peak 1 is most likely explained by an undefined noncovalent adduct of 12:0-NO2, we propose the presence of a “nitroalkane-alkene” as a result of saturation of the 9-cis-double bond with concomitant desaturation of the bond between carbons 6 and 7 (see Scheme 1) as explanation for peak 3.
SCHEME 1.
SCHEME 1.
Proposed mechanism for the generation of a “nitro-alkane-alkene” from 18:1-NO2. The nitro-alkane-alkene can be formed either via the oxidation of 18:1-NO2 to 18:2-NO2 and the subsequent desaturation of the 9,10-double bond or via reduction of the 9,10-double bond of 18:1-NO2 and subsequent oxidation of 18:0-NO2 in the 6,7-position.
FIGURE 7.
FIGURE 7.
Concentrations of free 18:1-NO2 and adduction to plasma components. A, serum obtained 90 min after injection was used to assess adduction of nitro-9-cis-octadecenoic acid to plasma components. Samples were either treated directly with BME to acquire total 18:1-NO2, or only albumin was incubated with BME after protein separation by gel electrophoresis to obtain albumin-adducted 18:1-NO2, or analyzed without BME treatment to assess free 18:1-NO2. The bar graph demonstrates that only 5.7% of 18:1-NO2 is present in its free form. B, the left-hand panel shows the elution profile of BME-18:1-NO2 as assessed in MRM scan mode. The product ion scan of this moiety is displayed with the major fragments representing the parent ion (404.1), 18:1-NO2 (326.1), 18:1-NO2-NO2 (279.3), and NO2 (45.8). C, chromatogram assessed using MRM scan mode showing the elution profile for GSH-adducted 18:1-NO2 (2.71 min). On the right-hand side the product ion scan of GSH-18:1-NO2 is displayed. Fragments represent the parent ion (633.3), GSH-18:1-NO2-glutamic acid (504.3), GSH (305.9), GSH-H2O (287.9), GSH-[H2O + NH3] (271.9), and GSH-[2H2O + NH3] (253.9).
FIGURE 8.
FIGURE 8.
Reversible reaction of 18:1-NO2 with thiols. A, release of 18:1-NO2 from synthesized GSH-18:1-NO2 in phosphate buffer. The decrease of GSH-18:1-NO2 and the concomitant increase of free 18:1-NO2 over time is shown. No detectable concentrations of BME-adducted 18:1-NO2 could be obtained. B, after treatment of samples with BME, GSH-18:1-NO2 and free 18:1-NO2 were no longer detectable. Equal levels of BME-adducted 18:1-NO2 for all time points suggest complete transfer of 18:1-NO2 to BME. C, synthesized GSH-18:1-NO2 spontaneously decomposes to GSH and 18:1-NO2 demonstrating the reversibility of the electrophilic adduction of 18:1-NO2. In the presence of BME, free and GSH-adducted 18:1-NO2 were adducted to this stronger nucleophile.
FIGURE 9.
FIGURE 9.
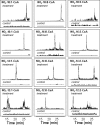
CoA derivatives of 18:1-NO2 and its metabolites in liver samples 90 min after intravenous injection. Liver samples of animals treated with vehicle or 18:1-NO2 were frozen with liquid nitrogen and homogenized. CoA derivatives were extracted using acetonitrile. Analysis was performed by HPLC-ESI MS in the MRM scan mode using mass transitions according to the expected differences of compounds to heptadecanoic acid-CoA (Table 1). Monitoring was performed for 18:1-NO2-CoA, 18:0-NO2-CoA, 18:2-NO2-CoA, and their respective metabolites. CoA derivatives of all observed β-oxidation metabolites could be detected in all treated animals. No CoA derivatives of nitrated fatty acids were detected in control animals. Each HPLC elution profile is presented with base peak intensity and does not reflect quantity relative to the other profiles. Multiple peaks were recorded for mass transitions of some metabolites. Identification of the peak reflecting the CoA derivative was carried out using elution times and EPI analysis (see Fig. 10).
FIGURE 10.
FIGURE 10.
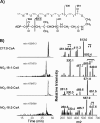
Identification and structural characterization of CoA derivatives of 18:1-NO2 and its metabolites by EPI analysis. A illustrates the molecular structure of heptadecanoic acid-CoA (17:0-CoA) and the fragments observed by CID in the EPI mode. Dissociation between ATP and pantothenate was found to be the characterizing fragmentation site in all metabolites (indicated by the bold line, 513 atomic mass units in the case of 17:0-CoA). The numbers pointing toward CoA describe masses of fragments resulting from dissociation at the corresponding site and concomitant fragmentation at the characteristic fragmentation site. These fragments were similar for all derivatives. The numbers pointing toward the methyl end of the structure changed for different derivatives according to the difference in mass between fatty acids. B, EPI analysis was performed for all observed CoA derivatives. Representative examples of each species are shown. The left column displays HPLC elution profiles acquired by MRM monitoring of transitions shown in Table 1. In the right column identifying EPI fragmentation patterns, which were used for characterization of the different metabolites, are illustrated. Relative intensities are displayed, which do not allow for quantity relative to the other profiles.
FIGURE 11.
FIGURE 11.
Tissue distribution of specific activity 90 min after intravenous injection of 3H-labeled 18:1-NO2. Panel A displays counts per gram of tissue (or milliliters in the case of plasma and urine). B, percentage of recovered specific activity per whole organ. In the case of fat and muscle total weight was estimated according to expected normal values (1.25 g for fat, 10 g for muscle).
SCHEME 2.
SCHEME 2.
Overview of the possible metabolic modifications of 18:1-NO2 and its disposition after intravenous injection in vivo. The assumed extracellular (large box), intracellular (large oval), and intramitochondrial (small oval) locations of distributional and metabolic steps of 18:1-NO2 are illustrated.

References

    1. Baker, P. R., Lin, Y., Schopfer, F. J., Woodcock, S. R., Groeger, A. L., Batthyany, C., Sweeney, S., Long, M. H., Iles, K. E., Baker, L. M., Branchaud, B. P., Chen, Y. E., and Freeman, B. A. (2005) J. Biol. Chem. 280 42464–42475 - PMC - PubMed
    1. O'Donnell, V. B., Eiserich, J. P., Chumley, P. H., Jablonsky, M. J., Krishna, N. R., Kirk, M., Barnes, S., rley-Usmar, V. M., and Freeman, B. A. (1999) Chem. Res. Toxicol. 12 83–92 - PubMed
    1. Napolitano, A., Camera, E., Picardo, M., and d'Ischia, M. (2000) J. Org. Chem. 65 4853–4860 - PubMed
    1. Lima, E. S., Di, M. P., and Abdalla, D. S. (2003) J. Lipid Res. 44 1660–1666 - PubMed
    1. Finlayson-Pitts, B. J., Sweetman, L. L., and Weissbart, B. (1987) Toxicol. Appl. Pharmacol. 89 438–448 - PubMed

Publication types

LinkOut - more resources