. 2008 Dec 1;22(23):3242-54.
doi: 10.1101/gad.1738708. Epub 2008 Nov 17.

microRNA-133a regulates cardiomyocyte proliferation and suppresses smooth muscle gene expression in the heart

Affiliations

microRNA-133a regulates cardiomyocyte proliferation and suppresses smooth muscle gene expression in the heart

Ning Liu et al. Genes Dev. .

Abstract

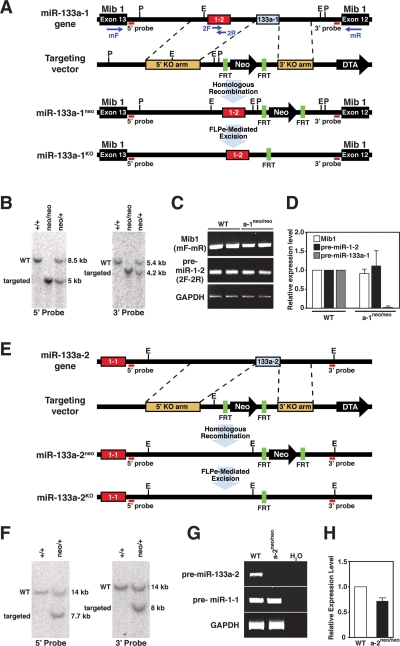
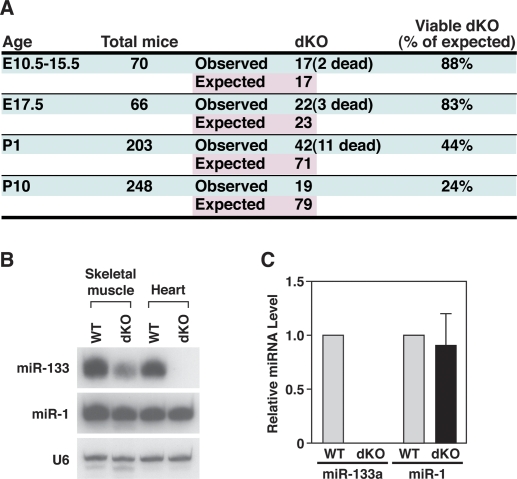
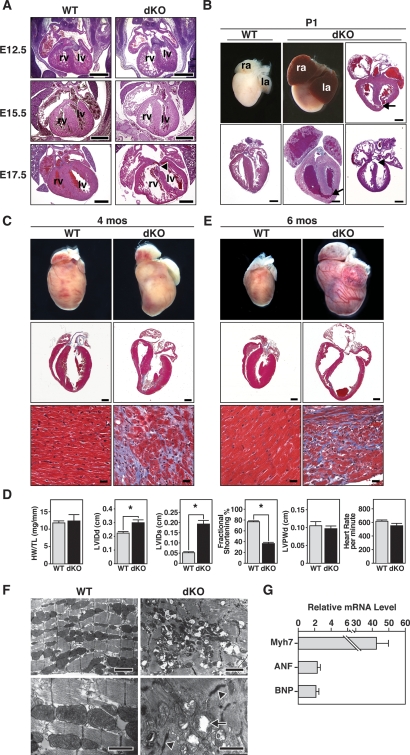
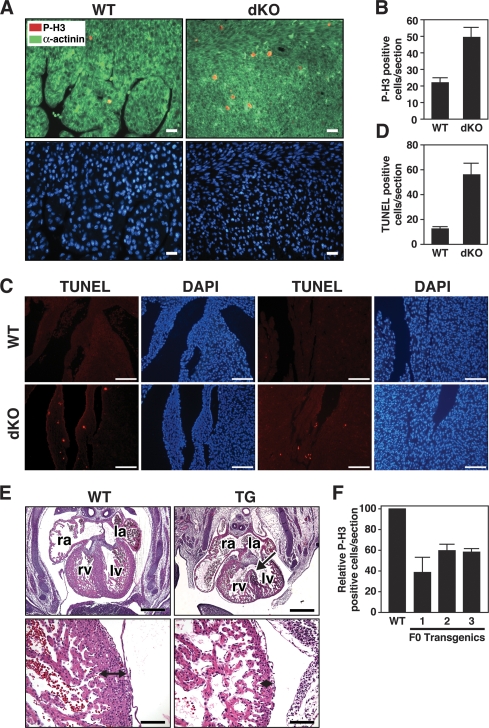
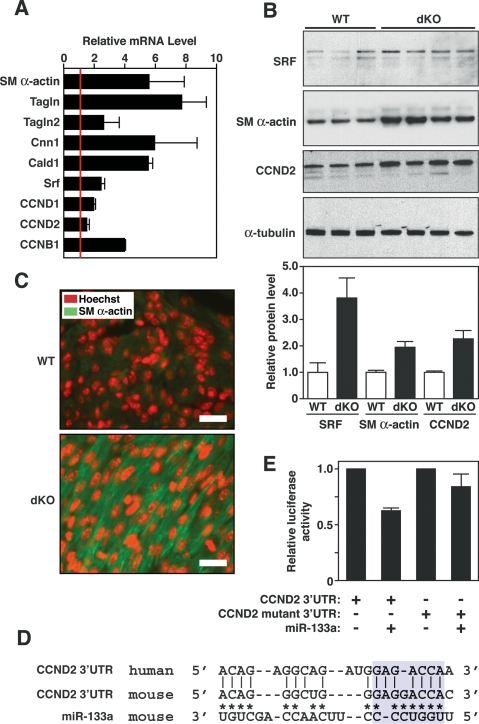
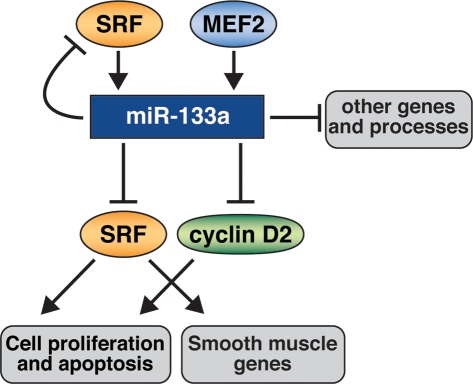
MicroRNAs (miRNAs) modulate gene expression by inhibiting mRNA translation and promoting mRNA degradation, but little is known of their potential roles in organ formation or function. miR-133a-1 and miR-133a-2 are identical, muscle-specific miRNAs that are regulated during muscle development by the SRF transcription factor. We show that mice lacking either miR-133a-1 or miR-133a-2 are normal, whereas deletion of both miRNAs causes lethal ventricular-septal defects in approximately half of double-mutant embryos or neonates; miR-133a double-mutant mice that survive to adulthood succumb to dilated cardiomyopathy and heart failure. The absence of miR-133a expression results in ectopic expression of smooth muscle genes in the heart and aberrant cardiomyocyte proliferation. These abnormalities can be attributed, at least in part, to elevated expression of SRF and cyclin D2, which are targets for repression by miR-133a. These findings reveal essential and redundant roles for miR-133a-1 and miR-133a-2 in orchestrating cardiac development, gene expression, and function and point to these miRNAs as critical components of an SRF-dependent myogenic transcriptional circuit.


Figures

Figure 1.
Figure 1.
Genomic organization of the miR-133 family. miR-133a-1 and miR-133a-2 have identical sequences, whereas miR-133b differs by 2 nt at the 3′ terminus. Each of the three miR-133 miRNAs is transcribed as a bicistronic transcript with miR-1-2, miR-1-1, or miR-206 as indicated. Genomic distances between the miR coding regions in the mouse genome and expression patterns of each miR cluster are shown.
Figure 2.
Figure 2.
Generation of miR-133a-1 and miR-133a-2 mutant mice. (A) Strategy for targeting of miR-133a-1. The miR-1-2/miR-133a-1 gene is located within intron 12 of the mind bomb 1 gene (Mib1). The genomic structure, targeting vector, and targeted allele for miR-133a-1 are shown. Pre-miR-133a-1 (68 bp) was replaced with a neomycin resistance cassette flanked by FRT sites, which allowed for FLPe recombinase-mediated excision. Probes for Southern blot analysis and primer positions for RT–PCR are shown. (E) EcoRI; (P) PstI. (B) Southern blot analysis for wild-type (WT) and miR-133a-1 mutant mice. Genomic tail DNA from agouti offspring was digested with PstI and probed with the indicated 5′ probe. The wild-type band migrated at 8.5 kb, and the targeted mutant band migrated at 5 kb, indicative of proper transmission of the targeted allele. Tail DNA was also digested with EcoRI and probed with the indicated 3′ probe. The wild-type band migrated at 5.4 kb, and the targeted mutant band migrated at 4.2 kb, confirming germline transmission of the targeted allele. Genotypes of mice are shown on top. (C) Expression of Mib1 and pre-miR-1-2 in wild-type and miR-133a-1 mutant mice detected by RT–PCR. RNA was isolated from hearts of adult wild-type and miR-133a-1 mutant mice (n = 2 for each genotype). Primer positions from A are shown in parentheses at the left. Primers 2F and 2R for miR-1-2 were located within the pre-miR-1-2 sequences. GAPDH mRNA was detected as a loading control. (D) Expression of Mib1, pre-miR-1-2, and pre-miR-133a-1 in wild-type and miR-133a-1 mutant mice detected by real-time PCR. Expression levels of each gene in miR-133a-1 mutant mice were normalized to GAPDH before comparison with expression in wild-type mice (n = 3 for each genotype). The Y-axis represents relative expression level compared with wild-type mice. Error bars indicate SEM. Pre-miR-133a-1 is not detected in miR-133a-1 mutant mice. (E) Strategy for targeting of miR-133a-2. The genomic structure, targeting vector, and targeted allele for miR-133a-2 are shown. Pre-miR-133a-2 (108 bp) was replaced with the neomycin resistance cassette flanked by FRT sites, which allowed for FLPe recombinase-mediated excision. Probes for Southern blot analysis are shown. (E) EcoRI. (F) Southern blot analysis for wild-type and miR-133a-2 mutant mice. Tail DNA from agouti off spring was digested with EcoRI and probed with the indicated 5′ and 3′ probes. Wild-type bands migrated at 14 kb and targeted mutant bands migrated at 7.7 kb using the 5′ probe and 8 kb using the 3′ probe. Genotypes of mice are shown on top. (G) Expression of pre-miR-133a-2 and pre-miR-1-1 in adult wild-type and miR-133a-2 mutant mice detected by RT–PCR. Primers for pre-miR-133a-2 and pre-miR-1-1 were located within their pre-stem–loop sequences. GAPDH levels were detected as a loading control. (H) Expression levels of pre-miR-1-1 in wild-type and miR-133a-2 mutant mice detected by real-time PCR. Expression of pre-miR-1-1 in miR-133a-2 mutant mice was normalized to GAPDH before comparison with expression in wild-type mice (n = 3 for each genotype). The Y-axis represents relative expression levels compared with wild-type mice. Error bars indicate the SEM.
Figure 3.
Figure 3.
Expression of miR-133a and miR-1 in mutant mice. (A) Genotypes of offspring from miR-133a mutant intercrosses. Timed matings were set up from miR-133a-1neo/neo; miR-133a-2neo/+ intercrosses, or from miR-133a-1neo/+; miR-133a-2neo/neo intercrosses to obtain dKO embryos. dKO mice were also intercrossed with miR-133a-1neo/neo; miR-133a-2neo/+ mice to obtain dKO mice at P1 and P10. Mice were genotyped at the indicated ages. Numbers of total mice analyzed, dKO mice observed, and dKO mice expected, based on Mendelian inheritance, are shown. (B) Northern blot analysis of heart and skeletal muscle RNA from wild-type and mutant mice at P1. Ten micrograms of RNA from skeletal muscle and heart tissues were used in the Northern blots. 32P-labeled Star-Fire probes for miR-133a and miR-1 were used. U6 probe was used as a loading control. (C) Expression levels of miR-133a and miR-1 in hearts of wild-type and dKO mutant mice at P1 detected by real-time PCR. Expression of miR-133a and miR-1 was normalized to U6 (n = 3 for each genotype). Error bars indicate the SEM.
Figure 4.
Figure 4.
Abnormalities of embryonic and adult dKO mutant hearts. (A) Sections of wild-type and dKO hearts during embryogenesis. At E12.5, E15.5, and E17.5, dKO hearts were normal, except for dilatation of the RV and thinning of the RV-free wall. Arrowhead indicates VSD near the atrioventricular valve. (rv) Right ventricle; (lv) left ventricle. Bar, 500 μm. (B) Whole hearts and longitudinal sections of wild-type and dKO hearts at P1. Arrows point to VSD at the apex of heart and arrowhead to VSD near atrioventricular valve. Sections of three different dKO hearts are shown. (ra) Right atrium; (la) left atrium. Bar, 500 μm. (C) Hearts of wild-type and dKO mutant mice at 4 mo of age. Whole-mount pictures of the hearts are shown in the top panel. The middle panels show histological sections stained with Masson’s trichrome. The bottom panels show the interventricular septum at high magnification. Note extensive fibrosis of dKO heart, especially at the junction of the interventricular septum, where VSDs were frequently observed. (Middle panel) Bar, 1 mm. (Bottom panel) Bar, 20 μm. (D) Analyses of cardiac function by echocardiography. Four-month-old male miR-133a dKO mice and their control littermates (n = 11 for each group) were analyzed. (HW/TL) Heart weight-to-tibia length ratio; (LVIDd) left ventricular internal diameter at end-diastole; (LVIDs) left ventricular internal diameter at end-systole; (LVPWd) left ventricle posterior wall thickness at end-diastole. Asterisks indicate statistical significance. The P-values for the following measurements are HW/TL: P = 0.7684; LVIDd: P = 0.0065; LVIDs: P = 3.9e-007; fractional shortening: P = 2.0e-011; LVPWd: P = 0.5424; heart rate: P = 0.1102. (E) Hearts of wild-type and dKO mutant mice that died suddenly at 6 mo of age. Whole-mount pictures and Masson’s trichrome-stained sections of hearts of wild-type and dKO mice at the time of death are shown. The bottom panels show the interventricular septum at high magnification. Note severe ventricular dilatation and fibrosis of dKO hearts. (Middle panel) Bar, 1 mm. (Bottom panel) Bar, 20 μm. (F) Transmission electron micrographs of adult wild-type and dKO mutant mice at 4 mo of age show disorganized sarcomeres and mitochondrial abnormalities in the mutant. Arrowheads point to abnormal Z-lines and arrows point to mitochondria in dKO mutant heart. (Top panels) Bar, 2 μm. (Bottom panel) Bar, 1 μm. (G) Transcripts for the indicated markers of cardiac stress were measured by real-time PCR in RNA samples from wild-type and dKO mice at 4 mo of age. Expression levels in dKO mice are expressed relative to expression in wild-type mice (n = 3 for each genotype). Error bars indicate the SEM.
Figure 5.
Figure 5.
Abnormal cardiomyocyte proliferation and apoptosis in miR-133a dKO hearts. (A) Immunohistochemistry on heart sections of wild-type and dKO mutant mice at P1. Phospho-histone H3 (red), α-actinin (green), and Hoechst (blue) staining at 40× magnification show increased proliferation in the cardiomyocytes in dKO mutant mice. Bar, 20 μm. (B) Quantification of phospho-histone H3-positive cells was performed on three sections from each heart and averaged from six individual hearts. Error bars indicate the SEM. (C) TUNEL staining of wild-type and dKO hearts at P1 showed increased apoptosis in dKO mice. TUNEL-positive cells are located near the base (left panels) and apex (right panels) of the heart in dKO mice. DAPI staining indicates nuclei. Bar, 100 μm. (D) TUNEL-positive cells were quantified on multiple sections from each dKO heart. Error bars indicate the SEM. (E) Transgenic overexpression of miR-133a blocks proliferation of cardiomyocytes in vivo. Histological sections of wild-type and βMHC-miR-133a transgenic hearts at E13.5 are shown. The arrow in the top right panel points to a VSD. The bottom panels show higher magnifications of the left ventricular myocardium, which is about eight cells thick in wild type and only two cells thick in the transgenic. (Top panel) Bar, 500 μm. (Bottom panel) Bar, 100 μm. (F) Quantification of phospho-histone H3-positive cells in histological sections of hearts from wild-type and three independent F0 βMHC-miR-133a transgenic hearts at E13.5. Phospho-histone H3-positive cells were counted on three sections for each transgenic heart and normalized to the number of phospho-histone H3-positive cells of wild-type littermates. Error bars indicate the SEM.
Figure 6.
Figure 6.
Modulation of miR-133a targets in dKO hearts. (A) Expression of smooth muscle-specific genes and cyclin genes in hearts of wild-type and dKO mutant mice at P1 as detected by real-time PCR. Expression levels for each gene in dKO hearts were normalized to GAPDH and compared with wild-type hearts. Error bars indicate the SEM. (SM α-actin) Smooth muscle α-actin; (TAGLN) transgelin (also called SM22); (TAGLN2) transgelin 2 (also named SM22β); (CNN1) calponin I; (CALD1) caldesmon; (CCND1) cyclin D1; (CCND2) cyclin D2; (CCNB1) cyclin B1. (B) Expression of SRF, SM α-actin, and CCND2 in wild-type and dKO mutant hearts. Western blot analysis was performed on hearts from P1 wild-type (n = 3) and dKO mutant (n = 4) mice. α-Tubulin was detected as a loading control. Quantification of bands by densitometry showed a 3.5-fold and twofold increase in expression of SRF, SM α-actin, and CCN2 in dKO compared with wild-type hearts. (C) Increased SM α-actin expression in dKO hearts at P1. Histological sections of wild-type and dKO mutant hearts at P1 were stained for SM α-actin (green) and for nuclei with Hoechst (red). Pictures of wild-type and dKO hearts were taken under the same exposure parameters. Bar, 20 μm. Hoechst staining was reproducibly more intense in sections of dKO hearts compared with wild type, which may reflect greater DNA synthesis in the mutant. (D) Sequence alignment of the human and mouse cyclin D2 3′ UTR and miR-133a. Asterisks point to Watson-Crick base-pairing between mouse cyclin D2 3′ UTR and miR-133a. Base-pairing between miR-133a seed sequences with cyclin D2 3′ UTR is highlighted in blue. Mutations in cyclin D2 3′ UTR were introduced to disrupt base-pairing with the seed sequences. (E) Luciferase assay of cyclin D2 3′ UTR in Cos-1 cells. Wild-type and mutant cyclin D2 3′ UTR sequences were cloned into luciferase-reporter constructs and were cotransfected with a plasmid expressing miR-133a into Cos-1 cells. Forty-eight hours post-transfection, luciferase activity was measured and normalized to β-galactosidase activity. Error bars represent the SEM.
Figure 7.
Figure 7.
A model for the functions of miR-133a in the heart. SRF and MEF2 activate miR-133a expression, which directly or indirectly represses genes involved in many aspects of heart development and function, including sarcomeric structures, cell proliferation, apoptosis, and the smooth muscle gene program. miR-133a directly targets SRF, which provides a negative feedback loop to precisely modulate SRF activity.

Comment in

  • Right into the heart of microRNA-133a.
    Meder B, Katus HA, Rottbauer W. Meder B, et al. Genes Dev. 2008 Dec 1;22(23):3227-31. doi: 10.1101/gad.1753508. Genes Dev. 2008. PMID: 19056878 Free PMC article.

References

    1. Baek D., Villen J., Shin C., Camargo F.D., Gygi S.P., Bartel D.P. The impact of microRNAs on protein output. Nature. 2008;455:64–71. - PMC - PubMed
    1. Black F.M., Packer S.E., Parker T.G., Michael L.H., Roberts R., Schwartz R.J., Schneider M.D. The vascular smooth muscle α-actin gene is reactivated during cardiac hypertrophy provoked by load. J. Clin. Invest. 1991;88:1581–1588. - PMC - PubMed
    1. Boutz P.L., Chawla G., Stoilov P., Black D.L. MicroRNAs regulate the expression of the alternative splicing factor nPTB during muscle development. Genes & Dev. 2007a;21:71–84. - PMC - PubMed
    1. Boutz P.L., Stoilov P., Li Q., Lin C.H., Chawla G., Ostrow K., Shiue L., Ares M., Black D.L. A post-transcriptional regulatory switch in polypyrimidine tract-binding proteins reprograms alternative splicing in developing neurons. Genes & Dev. 2007b;21:1636–1652. - PMC - PubMed
    1. Care A., Catalucci D., Felicetti F., Bonci D., Addario A., Gallo P., Bang M.L., Segnalini P., Gu Y., Dalton N.D., et al. MicroRNA-133 controls cardiac hypertrophy. Nat. Med. 2007;13:613–618. - PubMed

Publication types