. 2009 Jul;19(7):1687-703.
doi: 10.1093/cercor/bhn205. Epub 2008 Nov 17.

Seeing with profoundly deactivated mid-level visual areas: non-hierarchical functioning in the human visual cortex

Affiliations

Seeing with profoundly deactivated mid-level visual areas: non-hierarchical functioning in the human visual cortex

Sharon Gilaie-Dotan et al. Cereb Cortex. 2009 Jul.

Abstract

A fundamental concept in visual processing is that activity in high-order object-category distinctive regions (e.g., lateral occipital complex, fusiform face area, middle temporal+) is dependent on bottom-up flow of activity in earlier retinotopic areas (V2, V3, V4) whose main input originates from primary visual cortex (V1). Thus, activity in down stream areas should reflect lower-level inputs. Here we qualify this notion reporting case LG, a rare case of developmental object agnosia and prosopagnosia. In this person, V1 was robustly activated by visual stimuli, yet intermediate areas (V2-V4) were strongly deactivated. Despite this intermediate deactivation, activity in down stream visual areas remained robust, showing selectivity for houses and places, while selectivity for faces and objects was impaired. The extent of impairment evident in functional magnetic resonance imaging and electroencephalography activations was somewhat larger in the left hemisphere. This pattern of brain activity, coupled with fairly adequate everyday visual performance is compatible with models emphasizing the role of nonlinear local "amplification" of neuronal inputs in eliciting activity in ventral and dorsal visual pathways as well as perceptual experience in the human brain. Thus, while the proper functioning of intermediate areas appears essential for specialization in the cortex, daily visual behavior and reading are maintained even with deactivated intermediate visual areas.


Figures
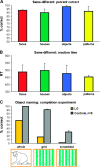
Figure 1.
Figure 1.
fMRI-related behavior in LG. (A, B) LG's average performance in the scanner in a 1-back same-different comparison task from the 3 category-selectivity scans (2 scans with line-drawing stimuli, 1 scan with grayscale pictures stimuli, see Methods for more details). Responses were collected via a response box. (A) percent correct, (B) reaction time. (C) LG's object naming performance (in percent correct, compared to 9 healthy controls) as measured immediately after the scan outside the scanner. The stimuli consisted of the stimuli from the completion experiment (Lerner et al. 2001), see Methods and Results for more details). Yellow bars indicate LG's performance, gray bars, controls. An illustration of the stimuli of the different conditions is given below the bars. Note that LG performed well above chance in the comparison task (A, B), while his performance was significantly impaired in the naming task (C). In the completion experiment (C), even though LG's performance was already below controls in the whole condition (controls: 100 ± 0%, LG: 62%), his performance dramatically dropped when parts of the image were occluded by bars (grid: controls: 90.8 ± 1.2%, LG: 17%; scrambeled: controls: 30.7 ± 12%, LG: 2%).
Figure 2.
Figure 2.
Visual activation: LG versus control. Left: typical control subject; right: LG, flattened and inflated cortical sheet. Yellow to orange represent visually activated voxels compared to fixation baseline, blue to turquoise represent visually deactivated voxels compared to fixation baseline. V1, primary visual area; CoS, colateral sulcus; IPS, intraparietal sulcus; STS, superior temporal sulcus; MT+, middle temporal motion-sensitive region. RH, right hemisphere; LH, left hemisphere. Black dotted lines represent retinotopic borders and MT+ border (defined in separate experiments for each subject).
Figure 3.
Figure 3.
Reproducibility of the visual response patterns of activations and deactivations in LG. Same presentation format, anatomical landmarks and statistical significance as in Figure 2, LG, flattened cortical representation. (A) LG's visual activation map in a different run of the same experimental protocol as in Figure 2. (B) A different run of the same experiment as in Figure 2, with gray-scale images as stimuli. (C) LG's visual activation map (fourth run) to an experimental protocol (Avidan et al. 2005) similar to that presented in Figure 2, viewing colored video clips of different categories. (D) LG's visual activation map in the completion experiment (Lerner et al. 2001). Note that the activation – deactivation pattern in LG's visual system is replicated in different scans with various experimental stimuli (line drawings, A, D; gray-scale pictures, B; and movie-clips, C), different task demands (panels A and B: same-different 1-back comparison, panel C: free viewing, panel D: silently naming the image without overt speech), and different block durations (panels A, B, and D: 9-s blocks with fixation periods of 6 s, panel C: 15-s blocks with fixation periods of 6 s).
Figure 4.
Figure 4.
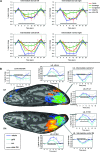
Regional time courses: LG versus controls. Average time courses of the controls (n = 9) are presented in the left most column; LG's average time courses (sampled from the 3 category-localizer runs he underwent) are presented in the middlle and right columns. The V1 average time courses are displayed in the top row (LG's right and left hemispheres are presented seperately since the right hemisphere was significantly different from both the left hemisphere and from the controls (see Results for details). V1 sampled regions were determined for LG as well as for controls according to activated patches within V1 retinotopic boundaries. Time courses sampled from intermediate-level regions are displayed in the middle row (LG's ventral and dorsal aspects are presented seperately since a significant difference was found between them; no inter-hemisphereic difference was found). Intermediate level regions were determined for controls based on retinotpic borders, so that the sampling was based on activated patches within V2–V3 regions. For LG, intermediate regions were sampled from the deactivated patches in the corresponding anatomical location of V2–V3 in controls. LO related time courses (sampled from the visually activated regions in the anatomical location of LO for both LG and controls) are displayed in the bottom row. The average response to the faces condition is indicated by the red curve, to houses in green, to objects in blue, and to the patterns condition in gray. Stimulus “ON” is indicated by a black line. Error bars denote SEM. Note the prominent deactivation to each of the categories in LG's intermediate areas (middle row). For more details see Methods and Results.
Figure 5.
Figure 5.
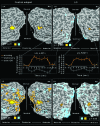
LG: Additional time courses. (A) Time courses from LG's intermediate deactivated regions from the category-related movie-clip experiment (Avidan et al. 2005), with block duration of 15 sec. Faces in red, buildings in green, navigation in light green, objects in blue and stimulus “ON” indicated by a black line. (B) Time courses from various regions in LG's cortex in the completion experiment (Lerner et al. 2001) presented along with a visual activation map. Whole indicated in blue, grid in turquoise, scrambled (scr) in gray. The activation map (same as the one presented in Fig. 3D) is displayed on a ventral view of LG's inflated cortical surface where the right side is the posterior part (occipital cortex) and the left is frontal cortex. LH, left hemisphere, RH, right hemisphere. Activation colors and threshold as in Figures 2 and 3. Importantly, the time courses presented here indicate that the deactivation patterns observed in LG's intermediate regions are not dependent on the stimulus duration and not dependent on the task (cf. longer deactivations (approx. 21 s) in (A) and deactivations in Figure 4 (approx. 12–15 s); c.f. deactivations while free viewing (A), naming objects (B), and 1-back comparison task (Fig. 4). Note also deactivated region in frontal cortex. These data indicate that the deactivations are a negative response to the visual stimulus and not a delayed hemodynamic response or a task confound.
Figure 6.
Figure 6.
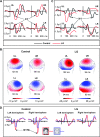
VEP and N170: LG versus controls. Electrophysiological activity elicited by LG's visual system and controls at different hierarchical levels. (A) V1-related C1 component: VEPs with sources in the calcarine cortex recorded at the parieto-occipital midline site (POz) in response to stimuli presented separately in the upper left (UL), upper right (UR), lower left (LL), and lower right (LR) quadrants of the visual field (Di Russo et al. 2002) (see Methods). The C1 latencies were delayed in LG relative to the controls (see Results for details). (B) Scalp current density (SCD) distributions at the peak of C1 elicited by stimulation in each of the four quadrants of the visual field. The sources and the sinks of the C1 dipole sources are typical for LG (right panel) and for controls. The larger amplitudes recorded in LG reflect the difference between the average of two very similar patterns within subject relative to the average of 6 participants in the control group. (C) The extrastriate N1 components recorded at right and left parieto-occipital sites (PO6 and PO5) (VEP experiment). The waveforms presented were recorded contralateral to the stimulated hemifield. Note the complete absence of N1 across hemifields for upper quadrants stimulation. (D). The high-order associated N170 component recorded at the lateral posterior-temporal sites (P9 and P10) in response to faces and watches. Note the absence of any N170-effect (that is, no special sensitivity to faces) in LG compared with the prominent normal N170-effect in the control group.
Figure 7.
Figure 7.
Category selectivity in high-order cortex: LG versus control. Left, typical control subject; right, LG. Same presentation format and anatomical landmarks as in Figure 2. Red represents face-selective regions; green, house selective; blue, object selective.
Figure 8.
Figure 8.
Motion sensitivity in LG versus control. Same presentation format and anatomical landmarks as in Figure 2 (LG, right, control, left). Yellow indicates motion-sensitive voxels (test: motion > static; Hasson et al. 2003), light blue indicates static preference (static > motion). Motion sensitivity was found in LG in the expected MT+ location (top panels maps set at high threshold). These maps at high threshold indicate the MT+ ROI definition. At lower threshold, however, this motion sensitivity in LG did not expand beyond MT+, as typically found in controls (bottom panels maps set at lower threshold). The average time courses of LG's right and left MT+ (as sampled from the motion-selectivity experiment) are presented in the mid pannels (orange indicates response to motion blocks, gray indicates response to static blocks).

Similar articles

Cited by

References

    1. Adams DL, Sincich LC, Horton JC. Complete pattern of ocular dominance columns in human primary visual cortex. J Neurosci. 2007;27:10391–10403. - PMC - PubMed
    1. Aminoff E, Gronau N, Bar M. The parahippocampal cortex mediates spatial and nonspatial associations. Cereb Cortex. 2007;17:1493–1503. - PubMed
    1. Amunts K, Armstrong E, Malikovic A, Hömke L, Mohlberg H, Schleicher A, Zilles K. Gender-specific left-right asymmetries in human visual cortex. J Neurosci. 2007;27:1356–1364. - PMC - PubMed
    1. Andrews TJ, Halpern SD, Purves D. Correlated size variations in human visual cortex, lateral geniculate nucleus, and optic tract. J Neurosci. 1997;17:2859–2868. - PMC - PubMed
    1. Ariel R, Sadeh M. Congenital visual agnosia and prosopagnosia in a child: a case report. Cortex. 1996;32:221–240. - PubMed

Publication types