. 2009 Feb;181(2):767-81.
doi: 10.1534/genetics.108.089292. Epub 2008 Nov 17.

A high-density single nucleotide polymorphism map for Neurospora crassa

Affiliations

A high-density single nucleotide polymorphism map for Neurospora crassa

Randy Lambreghts et al. Genetics. 2009 Feb.

Abstract

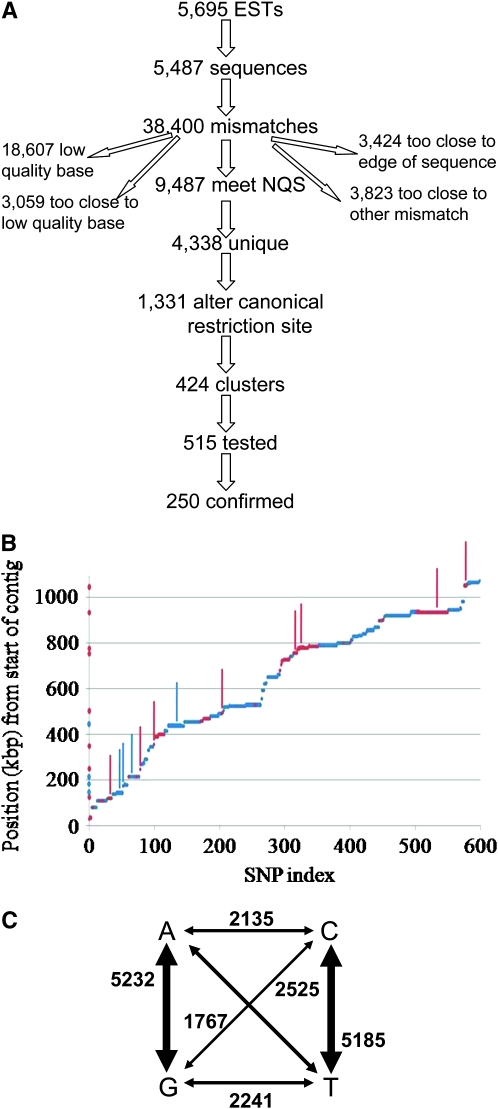
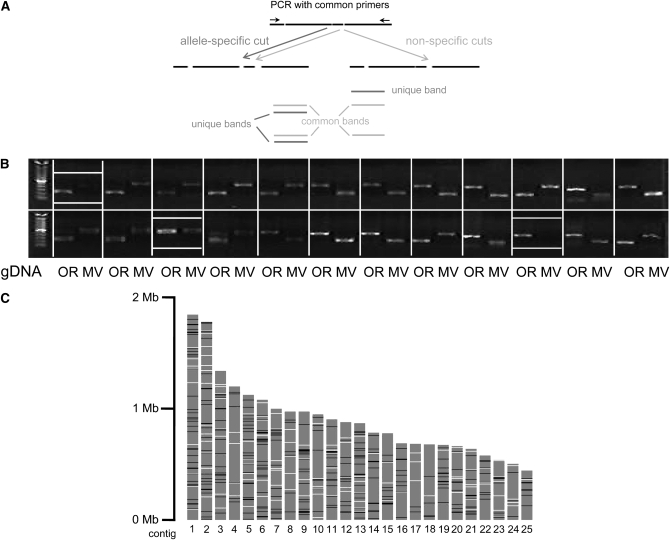
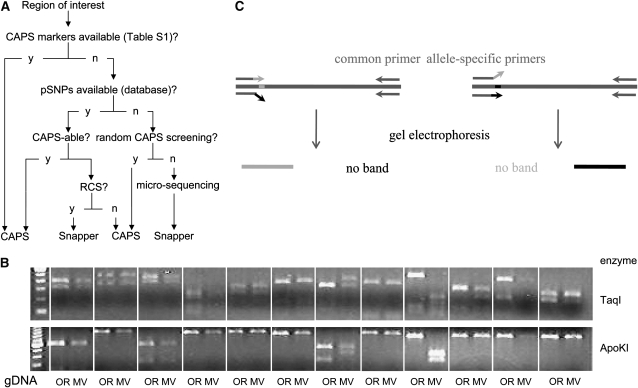
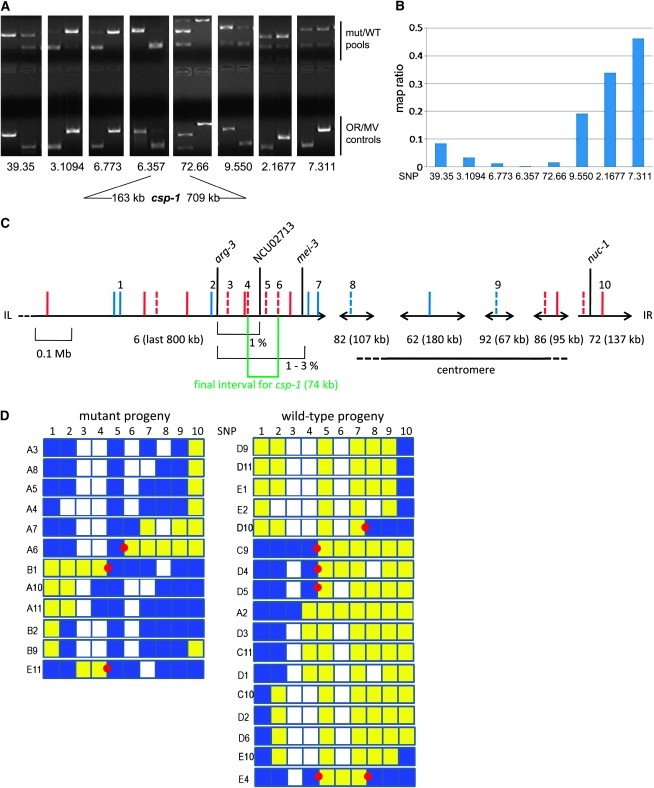
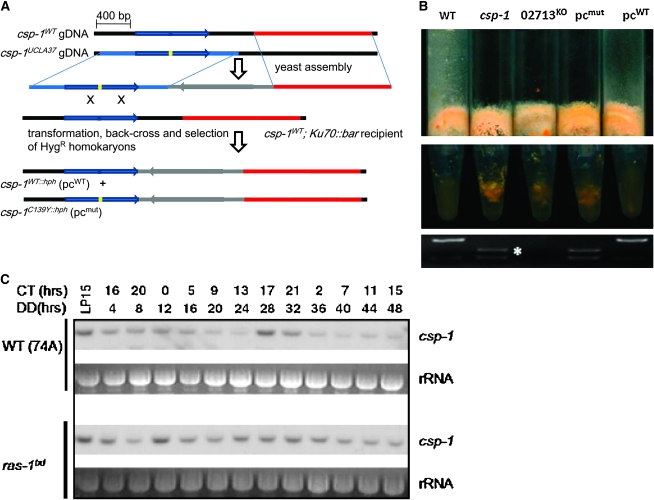
We report the discovery and validation of a set of single nucleotide polymorphisms (SNPs) between the reference Neurospora crassa strain Oak Ridge and the Mauriceville strain (FGSC 2555), of sufficient density to allow fine mapping of most loci. Sequencing of Mauriceville cDNAs and alignment to the completed genomic sequence of the Oak Ridge strain identified 19,087 putative SNPs. Of these, a subset was validated by cleaved amplified polymorphic sequence (CAPS), a simple and robust PCR-based assay that reliably distinguishes between SNP alleles. Experimental confirmation resulted in the development of 250 CAPS markers distributed evenly over the genome. To demonstrate the applicability of this map, we used bulked segregant analysis followed by interval mapping to locate the csp-1 mutation to a narrow region on LGI. Subsequently, we refined mapping resolution to 74 kbp by developing additional markers, resequenced the candidate gene, NCU02713.3, in the mutant background, and phenocopied the mutation by gene replacement in the WT strain. Together, these techniques demonstrate a generally applicable and straightforward approach for the isolation of novel genes from existing mutants. Data on both putative and validated SNPs are deposited in a customized public database at the Broad Institute, which encourages augmentation by community users.


Figures

F<sc>igure</sc> 1.—
Figure 1.—
SNP discovery. (A) Of all sequenced MV ESTs, 5487 aligned consistently with the OR genome, and these contained 38,400 mismatches. Of these, 9487 met NQS criteria (see materials and methods); the remainder was excluded for the reasons shown. Because of redundancy in the library, these corresponded to 4338 unique putative SNPs (pSNPs), of which 1331 alter 1 of 10 common four-base restriction sites. These were divided over 424 clusters (see materials and methods), and at least one pSNP in each cluster was tested until 250 were unambiguously confirmed. (B) Distribution of 599 putative SNPs along contig 6. Position from the start of the contig (in kilobase pairs) is plotted as a function of pSNP index (rank order of the pSNP's physical position along the contig). Note the long horizontal stretches showing groups of closely linked and thus functionally redundant SNPs. Red dots denote pSNPs included in genomewide validation; blue dots denote other pSNPs; red bars (projected on y-axis for clarity) mark confirmed SNPs from genomewide validation; blue bars mark confirmed SNPs from regional validation. (C) Frequency of transition and transversion events (based on complete set of 17,394 putative SNPs).
F<sc>igure</sc> 2.—
Figure 2.—
SNP validation. (A) Principle of cleaved amplified polymorphic sequence (CAPS) assay. A genomic region containing an allele-specific restriction site (dark gray, present in the left and absent in the right allele) and possibly common restriction sites (light gray) is amplified by PCR with a common pair of primers. Subsequent digestion produces several fragments, some of which are unique to one allele. These can be visualized by gel electrophoresis. (B) Representative gel for SNP validation. Digested PCR fragments obtained from Oak Ridge (OR) and Mauriceville (MV) are loaded side by side for 24 pSNPs. Common negative results include failure to efficiently amplify from MV gDNA and absence of the expected extra site in MV (boxed). (C) SNP coverage in the 25 largest contigs (shaded bars). Available EST sequence (used for genomewide validation) is denoted by open and validated CAPS markers by solid bars (resolution 5 kbp).
F<sc>igure</sc> 3.—
Figure 3.—
Distribution of sequenced ESTs and CAPS markers. Optical, physical, and genetic maps of the left arms of N. crassa linkage groups I and II. In the gray bars marked “EST,” bright green dashes represent 3-kbp bins in which EST sequences used for genomewide validation were obtained; dark green dashes, idem for additional EST data. In the bar marked “SNP” red dashes represent confirmed CAPS markers, black dashes confirmed CAPS markers that were selected for inclusion in the master plates. Exact location, primer sequences, and restriction enzymes are given in supplemental Table S1.
F<sc>igure</sc> 4.—
Figure 4.—
Development of local SNP markers. (A) General approach for efficient marker development. The first choice for markers in the region of interest consists of the set of validated CAPS markers described in supplemental Table S1. When these are exhausted but pSNPs are available, these can be developed as either CAPS or single nucleotide amplified polymorphism (SNAP) markers. Finally, additional polymorphisms can be found by random CAPS screening (RCS) or sequencing of randomly chosen PCR fragments. (B) Representative gel for random CAPS screening. Amplicons were prepared from 12 intergenic regions, using Oak Ridge (OR) or Mauriceville (MV) gDNA and digested with different enzymes. Note more irregular nature of digestion patterns compared to CAPS markers found by genomewide validation (Figure 2B). (C) Principle of SNAP assay. Two PCR reactions are carried out, using a common primer and either of two allele-specific primers. The latter are designed to be perfectly complementary to one allele but not the other, so that genomic DNA containing a specific allele is amplified only in the reaction employing its respective primer. Presence or absence of PCR products is visualized by gel electrophoresis.
F<sc>igure</sc> 5.—
Figure 5.—
Mapping of csp-1. (A) Local bulked segregant assay. CAPS assay performed on 8 markers equally spaced on LGI (physical location given as 〈contig〉.〈distance from start of contig in kb〉). Odd lanes, mutant pools, and OR control, even lanes, WT pool, and MV control. (B) Map ratios (see text) estimated from band intensities for SNPs in A. (C) Summary of markers used for interval mapping of csp-1. Solid red bars, SNPs from genomewide validation; dashed red bars, SNPs from regional validation; solid blue bars, SNPs from random CAPS screening; dashed blue bars, AFLPs discovered during random CAPS screening. SNPs used are numbered 1 (6.564), 2 (6.322), 3 (6.269), 4 (6.212), 5 (6.173), 6 (6.139), 7 (6.17), 8 (82.9), 9 (92.50), and 10 (72.66). (D) Interval mapping. Genotype for selected mutant (left) and WT (right) progeny for SNPs numbered as in C. Blue, Oak Ridge; yellow, Mauriceville; white, n/d; red dots, most informative recombination events.
F<sc>igure</sc> 6.—
Figure 6.—
Identification and characterization of csp-1. (A) Schematic of gene replacement at the endogenous locus. Blue arrow, NCU02713 ORF; blue line, left flank; red line, right flank; gray line and arrow, hygromycin-resistance cassette containing hph ORF; blue and yellow bars, WT and C139Y allele, respectively, at 6.194611. The resulting strains are csp-1WT∷hph (pcWT) and csp-1C139Y∷hph (pcmut), which differ only at the Cys139 locus of the NCU02713 ORF. (B) Phenocopying of csp-1 by NCU02713KO and pcmut but not pcWT. Strains, including parental controls, were grown for 3 days at 30 LL on minimal medium and tapped sharply (top) or had their conidia transferred into water (middle). (Bottom) Genotype at the csp-1 locus. The C139Y mutation creates an additional RsaI restriction site (asterisk). (C) Representative Northern blots of csp-1 mRNA over a 48-hr time course, in WT (top) and ras-1bd (bottom) background. Both sets were performed on the same membrane and with identical exposure times.

References

    1. Altshuler, D., V. J. Pollara, C. R. Cowles, W. J. Van Etten, J. Baldwin et al., 2000. An SNP map of the human genome generated by reduced representation shotgun sequencing. Nature 407 513–516. - PubMed
    1. Bailey, L. A., and D. J. Ebbole, 1998. The fluffy gene of Neurospora crassa encodes a Gal4p-type C6 zinc cluster protein required for conidial development. Genetics 148 1813–1820. - PMC - PubMed
    1. Banno, S., N. Ochiai, R. Noguchi, M. Kimura, I. Yamaguchi et al., 2005. A catalytic subunit of cyclic AMP-dependent protein kinase, PKAC-1, regulates asexual differentiation in Neurospora crassa. Genes Genet. Syst. 80 25–34. - PubMed
    1. Beadle, G. W., and E. L. Tatum, 1941. Genetic control of biochemical reactions in Neurospora. Proc. Natl. Acad. Sci. USA 27 499–506. - PMC - PubMed
    1. Belden, W. J., L. F. Larrondo, A. C. Froehlich, M. Shi, C. H. Chen et al., 2007. The band mutation in Neurospora crassa is a dominant allele of ras-1 implicating RAS signaling in circadian output. Genes Dev. 21 1494–1505. - PMC - PubMed

Publication types