. 2008 Nov;43(3):210-20.
doi: 10.3164/jcbn.2008067. Epub 2008 Oct 31.

Role of vitamins C and e in regulating antioxidant and pro-oxidant markers in preeclampsia

Affiliations

Role of vitamins C and e in regulating antioxidant and pro-oxidant markers in preeclampsia

Mohd Suhail et al. J Clin Biochem Nutr. 2008 Nov.

Abstract

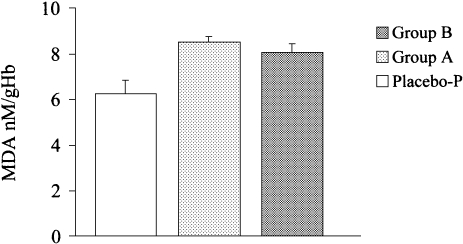
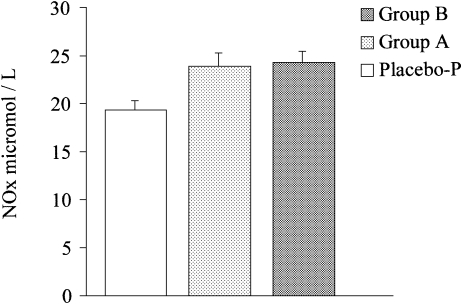
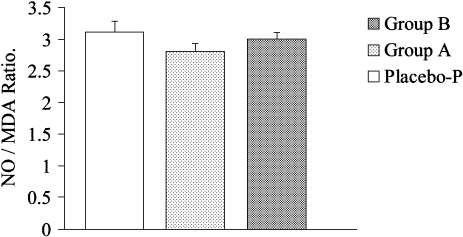
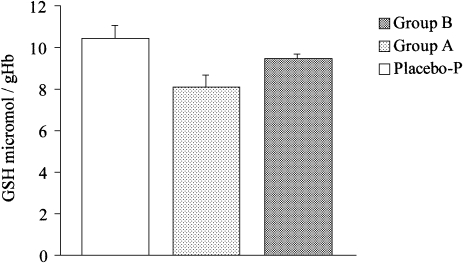
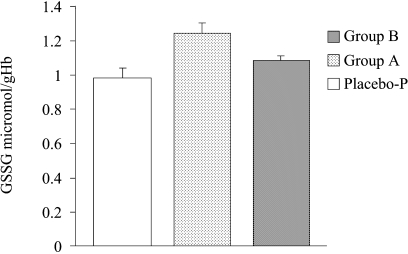
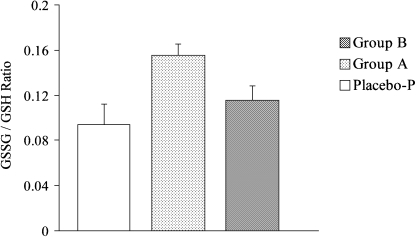
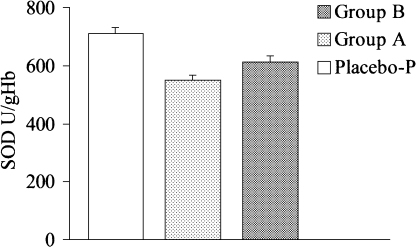
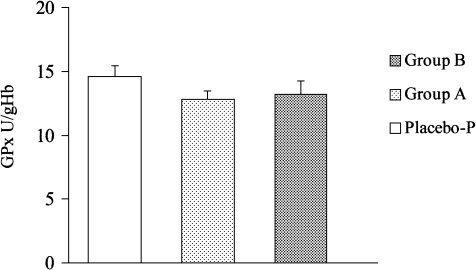
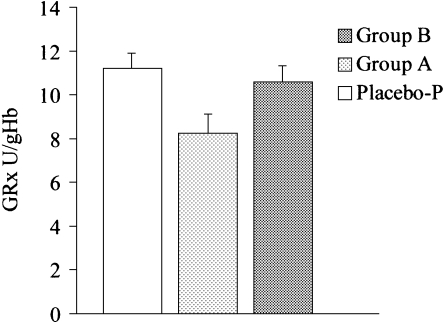
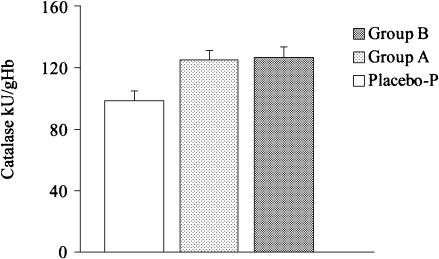
WE COMPARED THREE GROUPS OF PREGNANT WOMEN: placebo with normotensive women, group A which included preeclamptics, and group B which comprised preeclamptics who were supplemented their diets with vitamins C and E. MDA increased from 6.22 +/- 2.8 (placebo) to 8.48 +/- 1.2 (A) and 8.02 +/- 1.8 nmol/gHb (B). NO concentrations were enhanced from 19.3 +/- 4.2 (P) to 23.8 +/- 6.4 (A) and 24.1 +/- 5.4 micromol/L (B). GSH contents were decreased from 10.42 +/- 2.81 (P) to 8.02 +/- 2.92 (A) and 9.39 +/- 1.02 micromol/g Hb (B), whereas GSSG concentrations increased from 0.98 +/- 0.28 (P) to 1.24 +/- 0.29 (A) and 1.08 +/- 0.12 micromol/g Hb (B). SOD activity decreased 23% in A and 14% in B; GRx decreased 27% in A and 5.5% in B; GPx decreased 12% in A and 9.6% in B. Catalase activity, however, increased 27% in A and 29% in B as compared to control. Thus, we conclude that the use of vitamins C and E should be considered for the control of certain important biochemical indices during the development of preeclampsia; however, further studies are needed to develop methods for the prevention of preeclampsia in women at high risk.

Keywords: antioxidants & pro-oxidants; enzymatic & non-enzymatic; preeclampsia; vitamin C & E.


Figures

Fig. 1
Fig. 1
MDA contents. Columns show mean values. Vertical bars represent SEM. P = 6.22 ± 2.8 (SEM = 0.6261) A = 8.48 ± 1.2 (SEM = 0.2558) B = 8.02 ± 1.8 (SEM = 0.3928) Values are Mean ± SD. Group A- PE without Vit. Supplements compared to placebo-P (Difference highly significant, p = 0.0013); Group B- PE with Vit. Supplements compared to placebo-P (Difference significant, p = 0.0184); Group A compared to Group B (Difference not significant, p = 0.3278).
Fig. 2
Fig. 2
Nitric oxide contents. Columns show mean values. Vertical bars represent SEM. P = 19.3 ± 4.2 (SEM = 0.939) A = 23.8 ± 6.4 (SEM = 1.364) B = 24.1 ± 5.4 (SEM = 1.178) Values are mean ± SD. Group A- PE without Vit. Supplements compared to placebo-P (Difference significant, p = 0.0111); Group B- PE with Vit. Supplements compared to placebo-P (Difference highly significant, p = 0.003); Group A compared to Group B (Difference not significant, p = 0.8692).
Fig. 3
Fig. 3
Ratio of NO/MDA. Columns show mean values. Vertical bars represent SEM. P = 3.103 ± 0.8 (SEM = 0.1789) A = 2.807 ± 0.6 (SEM = 0.1279) B = 3.005 ± 0.5 (SEM = 0.1091) Values are mean ± SD. Group A- PE without Vit. Supplements compared to placebo-P (Difference not significant, p = 0.18); Group B- PE with Vit. Supplements compared to placebo-P (Difference not significant, p = 0.6389); Group A compared to Group B (Difference not significant, p = 0.2477).
Fig. 4
Fig. 4
Reduced glutathione contents. Columns show mean values. Vertical bars represent SEM. P = 10.42 ± 2.81 (SEM = 0.6283) A = 8.02 ± 2.92 (SEM = 0.6225) B = 9.39 ± 1.02 (SEM = 0.2226) Values are mean ± SD. Group A- PE without Vit. Supplements compared to placebo-P (Difference highly significant, p = 0.0099); Group B- PE with Vit. Supplements compared to placebo-P (Difference not significant, p = 0.1233); Group A compared to Group B (Difference significant, p = 0.0485).
Fig. 5
Fig. 5
Oxidized glutathione contents. Columns show mean values. Vertical bars represent SEM. P = 0.98 ± 0.28 (SEM = 0.0626) A = 1.24 ± 0.29 (SEM = 0.0618) B = 1.08 ± 0.12 (SEM = 0.0262). Values are mean ± SD. Group A- PE without Vit. Supplements compared to placebo-P (Difference highly significant, p = 0.0053); Group B- PE with Vit. Supplements compared to placebo-P (Difference not significant, p = 0.1419); Group A compared to Group B (Difference significant, p = 0.0241).
Fig. 6
Fig. 6
Ratio of GSSG/GSH in three groups. Columns show mean values. Vertical bars represent SEM. P = 0.0941 ± 0.08 (SEM = 0.01789) A = 0.155 ± 0.04 (SEM = 0.00853) B = 0.115 ± 0.06 (SEM = 0.01309) Values are mean ± SD. Group A- PE without Vit. Supplements compared to placebo-P (Difference highly significant, p = 0.003); Group B- PE with Vit. Supplements compared to placebo-P (Difference not significant, p = 0.3483); Group A compared to Group B (Difference significant, p = 0.0134).
Fig. 7
Fig. 7
Uric acid contents. Columns show mean values. Vertical bars represent SEM. P = 6.5 ± 1.02 (SEM = 0.2281) A = 9.2 ± 1.84 (SEM = 0.3923) B = 8.5 ± 1.51 (SEM = 0.3295). Values are Mean ± SD. Group A- PE without Vit. Supplements compared to placebo-P (Difference extremely significant, p<0.0001); Group B- PE with Vit. Supplements compared to placebo-P (Difference extremely significant, p<0.0001); Group A compared to Group B (Difference not significant, p = 0.1813).
Fig. 8
Fig. 8
Superoxide dismutase activities. Columns show mean values. Vertical bars represent SEM. P = 710 ± 90.6 (SEM = 20.259) A = 548 ± 92.8 (SEM = 19.785) B = 610 ± 102.2 (SEM = 22.302). Values are Mean ± SD. Group A- PE without Vit. Supplements compared to placebo-P (Difference extremely significant, p<0.0001); Group B- PE with Vit. Supplements compared to placebo-P (Difference highly significant, p = 0.002); Group A compared to Group B (Difference significant, p = 0.0434).
Fig. 9
Fig. 9
Glutathione peroxidase activities. Columns show mean values. Vertical bars represent SEM. P = 14.6 ± 3.8 (SEM = 0.85) A = 12.8 ± 3.2 (SEM = 0.682) B = 13.2 ± 4.8 (SEM = 1.047). Values are Mean ± SD. Group A- PE without Vit. Supplements compared to placebo-P (Difference not significant, p = 0.1036); Group B- PE with Vit. Supplements compared to placebo-P (Difference not significant, p = 0.3084); Group A compared to Group B (Difference not significant, p = 0.7484).
Fig. 10
Fig. 10
Glutathione reductase activities. Columns show mean values. Vertical bars represent SEM. P = 11.2 ± 3.08 (SEM = 0.6887) A = 8.22 ± 4.26 (SEM = 0.9082) B = 10.58 ± 3.32 (SEM = 0.7245). Vales are Mean ± SD. Group A- PE without Vit. Supplements compared to placebo-P (Difference significant, p = 0.0138); Group B- PE with Vit. Supplements compared to placebo-P (Difference not significant, p = 0.5395); Group A compared to Group B (Difference significant, p = 0.05).
Fig. 11
Fig. 11
Catalase activities. Columns show mean values. Vertical bars represent SEM. P = 98.2 ± 30.4 (SEM = 6.798) A = 124.8 ± 31.6 (SEM = 6.737) B = 126.6 ± 32.8 (SEM = 7.158). Values are Mean ± SD. Group A- PE without Vit. Supplements compared to placebo-P (Difference highly significant, p = 0.0084); Group B- PE with Vit. Supplements compared to placebo-P (Difference highly significant p = 0.0066); Group A compared to Group B (Difference not significant, p = 0.8555).

Similar articles

Cited by

References

    1. Chappell L.C. Effect of antioxidants on the occurrence of preeclampsia in women at increased risk: a randomized trial. Lancet. 1999;254:810–816. - PubMed
    1. Chappell L.C. Vitamin C and E supplementation in women at risk of preeclampsia is associated with changes in indices of oxidative stress and placental function. Am. J. Obstet. Gynecol. 2002b;187:777–784. - PubMed
    1. Mohindra A. Vitamin E and carotenes status in preeclamptic pregnant women from India. Panminerva Med. 2002;44:261–264. - PubMed
    1. Panburana P. Antioxidants nutrients and lipid peroxide levels in Thai preeclamptic women. J. Obstet. Gynaecol. Res. 2000;26:377–381. - PubMed
    1. Llurba E. A comprehensive study of oxidative stress and antioxidant status in preeclampsia and normal pregnancy. Free Radic. Biol. Med. 2004;37:557–570. - PubMed