

HIV prevalence rates among injection drug users in 96 large US metropolitan areas, 1992-2002
- PMID: 19015995
- PMCID: PMC2629516
- DOI: 10.1007/s11524-008-9328-1
HIV prevalence rates among injection drug users in 96 large US metropolitan areas, 1992-2002
Abstract
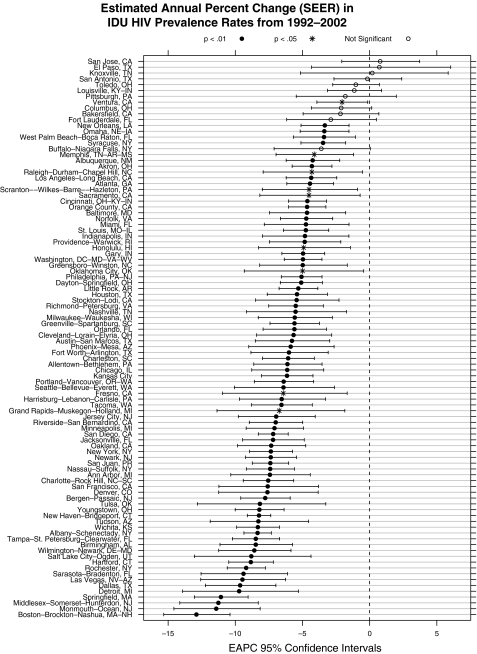
This research presents estimates of HIV prevalence rates among injection drug users (IDUs) in large US metropolitan statistical areas (MSAs) during 1992-2002. Trend data on HIV prevalence rates in geographic areas over time are important for research on determinants of changes in HIV among IDUs. Such data also provide a foundation for the design and implementation of structural interventions for preventing the spread of HIV among IDUs. Our estimates of HIV prevalence rates among IDUs in 96 US MSAs during 1992-2002 are derived from four independent sets of data: (1) research-based HIV prevalence rate estimates; (2) Centers for Disease Control and Prevention Voluntary HIV Counseling and Testing data (CDC CTS); (3) data on the number of people living with AIDS compiled by the CDC (PLWAs); and (4) estimates of HIV prevalence in the US. From these, we calculated two independent sets of estimates: (1) calculating CTS-based Method (CBM) using regression adjustments to CDC CTS; and (2) calculating the PLWA-based Method (PBM) by taking the ratio of the number of injectors living with HIV to the numbers of injectors living in the MSA. We take the mean of CBM and PBM to calculate over all HIV prevalence rates for 1992-2002. We evaluated trends in IDU HIV prevalence rates by calculating estimated annual percentage changes (EAPCs) for each MSA. During 1992-2002, HIV prevalence rates declined in 85 (88.5%) of the 96 MSAs, with EAPCs ranging from -12.9% to -2.1% (mean EAPC=-6.5%; p<0.01). Across the 96 MSAs, collectively, the annual mean HIV prevalence rate declined from 11.2% in 1992 to 6.2 in 2002 (EAPC, -6.4%; p<0.01). Similarly, the median HIV prevalence rate declined from 8.1% to 4.4% (EAPC, -6.5%; p<0.01). The maximum HIV prevalence rate across the 11 years declined from 43.5% to 22.8% (EAPC, -6.7%; p<0.01). Declining HIV prevalence rates may reflect high continuing mortality among infected IDUs, as well as primary HIV prevention for non-infected IDUs and self-protection efforts by them. These results warrant further research into the population dynamics of disease progression, access to health services, and the effects of HIV prevention interventions for IDUs.
Figures
Similar articles
-
Estimates of the population prevalence of injection drug users among hispanic residents of large US metropolitan areas.J Urban Health. 2012 Jun;89(3):527-64. doi: 10.1007/s11524-012-9670-1. J Urban Health. 2012. PMID: 22411420 Free PMC article.
-
Estimating the prevalence of injection drug users in the U.S. and in large U.S. metropolitan areas from 1992 to 2002.J Urban Health. 2008 May;85(3):323-51. doi: 10.1007/s11524-007-9248-5. Epub 2008 Mar 15. J Urban Health. 2008. PMID: 18344002 Free PMC article.
-
HIV among injection drug users in large US metropolitan areas, 1998.J Urban Health. 2005 Sep;82(3):434-45. doi: 10.1093/jurban/jti088. Epub 2005 Jul 13. J Urban Health. 2005. PMID: 16014877 Free PMC article.
-
Towards combination HIV prevention for injection drug users: addressing addictophobia, apathy and inattention.Curr Opin HIV AIDS. 2012 Jul;7(4):320-5. doi: 10.1097/COH.0b013e32835369ad. Curr Opin HIV AIDS. 2012. PMID: 22498479 Free PMC article. Review.
-
Integrating multiple programme and policy approaches to hepatitis C prevention and care for injection drug users: a comprehensive approach.Int J Drug Policy. 2007 Oct;18(5):417-25. doi: 10.1016/j.drugpo.2007.01.013. Epub 2007 Feb 20. Int J Drug Policy. 2007. PMID: 17854731 Review.
Cited by
-
Female and male differences in AIDS diagnosis rates among people who inject drugs in large U.S. metro areas from 1993 to 2007.Ann Epidemiol. 2015 Apr;25(4):218-25. doi: 10.1016/j.annepidem.2015.01.006. Epub 2015 Feb 7. Ann Epidemiol. 2015. PMID: 25724830 Free PMC article.
-
State laws, syringe exchange, and HIV among persons who inject drugs in the United States: History and effectiveness.J Public Health Policy. 2015 May;36(2):212-30. doi: 10.1057/jphp.2014.54. Epub 2015 Jan 15. J Public Health Policy. 2015. PMID: 25590514
-
Associations of place characteristics with HIV and HCV risk behaviors among racial/ethnic groups of people who inject drugs in the United States.Ann Epidemiol. 2016 Sep;26(9):619-630.e2. doi: 10.1016/j.annepidem.2016.07.012. Epub 2016 Aug 8. Ann Epidemiol. 2016. PMID: 27576908 Free PMC article.
-
Modeling a dynamic bi-layer contact network of injection drug users and the spread of blood-borne infections.Math Biosci. 2016 Mar;273:102-13. doi: 10.1016/j.mbs.2016.01.003. Epub 2016 Jan 14. Math Biosci. 2016. PMID: 26775738 Free PMC article.
-
Comparison of Rapid Point-of-Care Tests for Detection of Antibodies to Hepatitis C Virus.Open Forum Infect Dis. 2015 Jul 7;2(3):ofv101. doi: 10.1093/ofid/ofv101. eCollection 2015 Sep. Open Forum Infect Dis. 2015. PMID: 26269795 Free PMC article.
References
-
- None
- Brown BS, Beschner GM. Handbook on Risk of AIDS: Injection Drug Users and Sexual Partners. Westport, CT: Greenwood; 1993.
-
- {'text': '', 'ref_index': 1, 'ids': [{'type': 'PubMed', 'value': '7572963', 'is_inner': True, 'url': 'https://pubmed.ncbi.nlm.nih.gov/7572963/'}]}
- Friedman SR, Jose B, Deren S, Des Jarlais DC, Neaigus A. Risk factors for HIV seroconversion among out-of-treatment drug injectors in high- and low-seroprevalence cities. Am J Epidemiol. 1995;142:864–874. - PubMed
-
- {'text': '', 'ref_index': 1, 'ids': [{'type': 'DOI', 'value': '10.1016/S0140-6736(96)11380-5', 'is_inner': False, 'url': 'https://doi.org/10.1016/s0140-6736(96)11380-5'}, {'type': 'PubMed', 'value': '9269214', 'is_inner': True, 'url': 'https://pubmed.ncbi.nlm.nih.gov/9269214/'}]}
- Hurley SF, Jolley DJ, Kaldor JM. Effectiveness of needle-exchange programs for prevention of HIV infection. Lancet. 1997;21:1797–800. doi:10.1016/S0140-6736(96)11380-5. - PubMed
-
- {'text': '', 'ref_index': 1, 'ids': [{'type': 'DOI', 'value': '10.2105/AJPH.88.1.108', 'is_inner': False, 'url': 'https://doi.org/10.2105/ajph.88.1.108'}, {'type': 'PMC', 'value': 'PMC1508387', 'is_inner': False, 'url': 'https://pmc.ncbi.nlm.nih.gov/articles/PMC1508387/'}, {'type': 'PubMed', 'value': '9584014', 'is_inner': True, 'url': 'https://pubmed.ncbi.nlm.nih.gov/9584014/'}]}
- Kral AH, Bluthenthal RN, Booth RE, Watters JK. HIV seroprevalence among street-recruited injection drug and crack cocaine users in 16 US municipalities. Am J Public Health. 1998;88:108–113. - PMC - PubMed
-
- None
- Malliori M, Zunzunegui MV, Rodriguez-Arenas A, Goldberg D. Drug injecting and HIV-1 infection: major findings from a multi-city study. In: Stimson GV, Des Jarlais DC, Ball A, eds. Drug Injecting and HIV Infection: Global Dimensions and Local Responses. London: Taylor and Francis; 1998.
Publication types
MeSH terms
Grants and funding
LinkOut - more resources
Full Text Sources
Medical
Research Materials
