. 2009 Sep;128(1 Suppl):e287-95.
doi: 10.1111/j.1365-2567.2008.02961.x. Epub 2008 Nov 7.

Human CD4low CD25high regulatory T cells indiscriminately kill autologous activated T cells

Affiliations

Human CD4low CD25high regulatory T cells indiscriminately kill autologous activated T cells

Ewa Bryl et al. Immunology. 2009 Sep.

Abstract

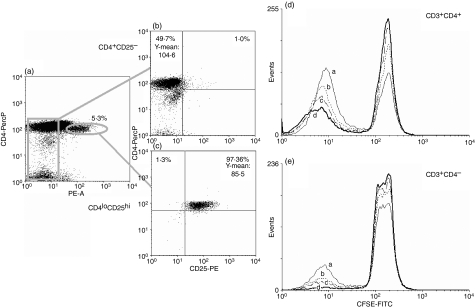
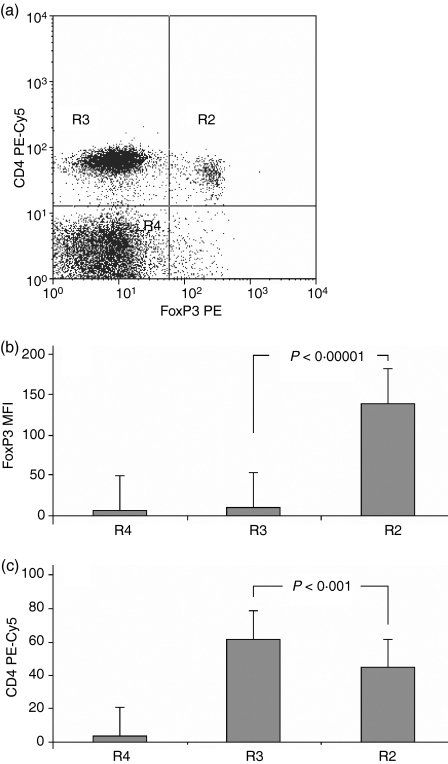
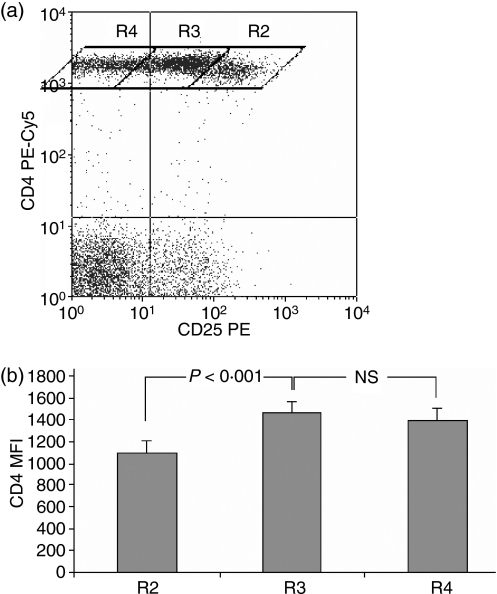
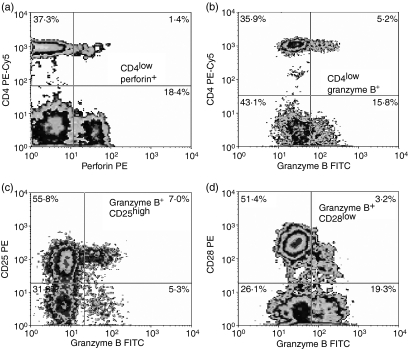
The interest of the scientific community in regulatory CD4(+) T cells has reached an enormously high level. Common agreement is that they inhibit not only the proliferation of CD4 and CD8 lymphocytes, but also the activities of natural killer cells and macrophages. However, very important issues concerning actual mechanism(s) and specificity of the action of regulatory T cells (Tregs) upon responder cells are still unsolved or vague. The best known marker for Tregs is the expression of transcription factor FoxP3, widely used for their enumeration. It is known that FoxP3 inhibits cytokine production so the most probable action of Tregs is direct. However, FoxP3 expression cannot be used for functional studies in humans. Therefore we identified human peripheral blood Tregs as a distinct, very well-defined population of peripheral blood T cells with reduced CD4 and high CD25 expression (CD4(low) CD25(high)), which fulfils the current phenotypic criteria identifying the Tregs by simultaneously expressing high amounts of FoxP3. We conclude that the definition of a CD4(low) CD25(high) phenotype is enough to unambiguously detect and study the regulatory function of these cells. On the functional level, the CD4(low) Tregs are able to non-specifically suppress the proliferation of autologous, previously polyclonally activated CD4(+) and CD4(-) lymphocytes and to kill them by direct contact, probably utilizing intracellular granzyme B and perforin.


Figures

Figure 6
Figure 6
CD4low CD25high lymphocytes inhibit the proliferation of autologous T cells in a dose-dependent manner. The experiment was set up as described in the Materials and methods. (a–c) Sorting strategy and the purities of resultant populations; Treg-depleted and CD25high-depleted peripheral blood mononuclear cells (PBMC) (b) purified CD4low CD25high Tregs (c). Sorted CD4low CD25high cells were admixed with the remaining Treg-depleted, CFSE-loaded, Con A-stimulated autologous PBMC at the following proportions: (a) none, (b) 5%, (c) 10% and (d) 20%, and their inhibitory activity was assessed after 120 hr in culture as the lowering proportion of CFSE-diluting proliferating CD4+ (d) and CD4 (e) lymphocytes. Both the sorting results and those of the proliferation inhibition test are representative for three experiments yielding similar results.
Figure 2
Figure 2
CD4low T cells express high FoxP3 protein level. (a) A representative dot plot revealing the existence of two subpopulations of CD4+ lymphocytes differing in both their CD4 and FoxP3 expression. (b) Mean fluorescence of FoxP3 is significantly higher in region R2 containing CD4low T cells than in region R3 containing normal CD4+ lymphocytes (n = 20, P < 0·00001). (c) The mean fluorescence of CD4 expression is significantly lower in the R2 region, as compared to the R3 region, proving that the cells in the R2 region are CD4low. Data are presented as means ± SD (n = 20, P < 0·001).
Figure 1
Figure 1
Distinct population of CD4lowlymphocytes shows the highest expression of CD25. (a) Division of the CD4+ lymphocyte population into three regions showing different CD4 and CD25 expression levels: R2, CD4low CD25high; R3, CD4+ CD25low/intermediate; R4, CD4+ CD25null based on CD25 expression and on distinction between the CD4+ and CD4low T cells, as described in ref. . A representative dot plot revealing the existence of three subsets of CD4+ T cells. (b) The R2 region contains CD4low T cells. The mean fluorescence of PE-Cy5-conjugated anti-CD4 is significantly lower in the R2 region compared with the R3 and R4 regions (n = 20, P < 0·001). Data are presented as means ± SD.
Figure 3
Figure 3
CD4low T cells express perforin (a, upper right panel) and granzyme B (b, upper right panel). Granzyme-B-positive CD4low T cells are CD25high (c, upper right panel) and CD28low (d, upper right panel) compared with lymphocytes with normal CD4 expression (upper left quadrants in all panels). Representative density plots for five experiments yielding similar results are shown.
Figure 4
Figure 4
CD4low T cells do not express any natural killer (NK) or NKT markers. Peripheral blood mononuclear cells (PBMC) were stained with anti-CD4 PE-Cy5 antibody and antibodies against CD16+56, CD94, CD158b, CD161 and iNKT markers as described in the Materials and methods. (a) The only marker present on CD4+ T cells is CD161, but the CD161-positive CD4+ T cells (R3 in a, b) had significantly higher CD4 expression, than CD161-negative CD4+ T cells (R2 in a, b) (b, data are presented as means ± SD). CD4+ T cells including the CD4low lymphocytes were negative for CD16+56 (c), CD94 (d), CD158b (e) and iNKT (f). Representative dot plots for 10 experiments yielding similar results are shown.
Figure 5
Figure 5
CD4low T cells form conjugates with autologous activated peripheral blood mononuclear cells (PBMC) and kill them. Formation of conjugates (visualized in the region R4) was determined at 0 min (a), 30 min (b) and 120 min (c) and their proportion in the total CD4+ population is shown. The T cells forming conjugates have a significantly lower CD4 expression than the remaining CD4+ cells. (d) After 240 min of conjugate formation, the dead cells were detected with 7-AAD staining. The majority of CFSE-positive cells in conjugates in the region R4 were also 7-AAD positive, while only a few free CD4+ cells in the region R2 were also stained with 7-AAD (arrowhead). Representative figures for five experiments yielding similar results are shown.

References

    1. Germain RN. Special regulatory T-cell review: a rose by any other name: from suppressor T cells to Tregs, approbation to unbridled enthusiasm. Immunology. 2008;123:20–7. - PMC - PubMed
    1. Tang Q, Bluestone JA. Regulatory T-cell physiology and application to treat autoimmunity. Immunol Rev. 2006;212:217–37. - PubMed
    1. Linehan DC, Goedegebuure PS. CD25+ CD4+ regulatory T-cells in cancer. Immunol Res. 2005;32:155–68. - PubMed
    1. Beissert S, Schwarz A, Schwarz T. Regulatory T cells. J Invest Dermatol. 2006;126:15–24. - PubMed
    1. Sakaguchi S, Hori S, Fukui Y, Sasazuki T, Sakaguchi N, Takahashi T. Thymic generation and selection of CD25+ CD4+ regulatory T cells: implications of their broad repertoire and high self-reactivity for the maintenance of immunological self-tolerance. Novartis Found Symp. 2003;252:6–16. - PubMed

Publication types