. 2009 Jan 23;284(4):2080-7.
doi: 10.1074/jbc.M804570200. Epub 2008 Nov 18.

Blockade of the erbB2 receptor induces cardiomyocyte death through mitochondrial and reactive oxygen species-dependent pathways

Affiliations

Blockade of the erbB2 receptor induces cardiomyocyte death through mitochondrial and reactive oxygen species-dependent pathways

Leo I Gordon et al. J Biol Chem. .

Abstract

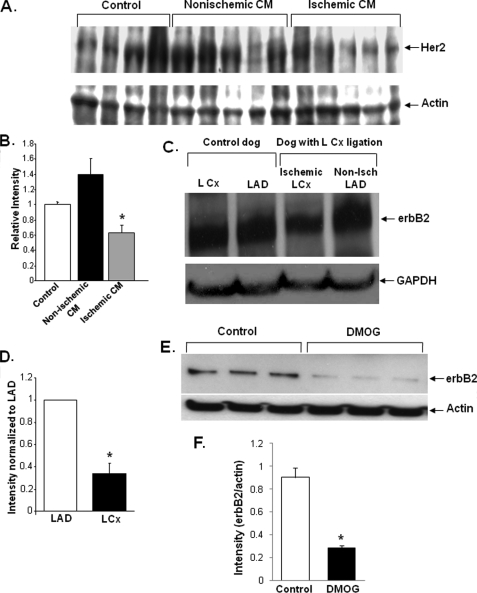
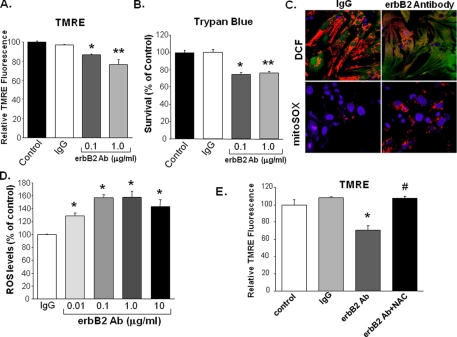
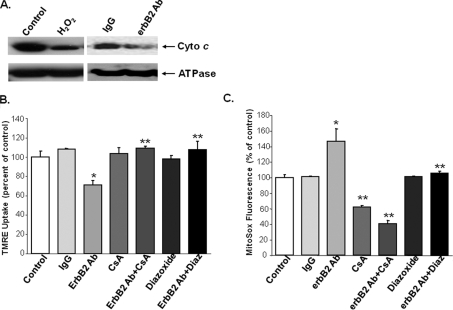
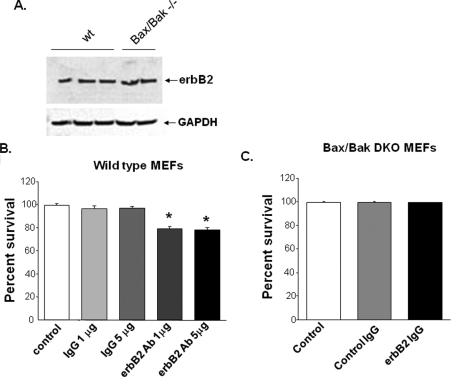
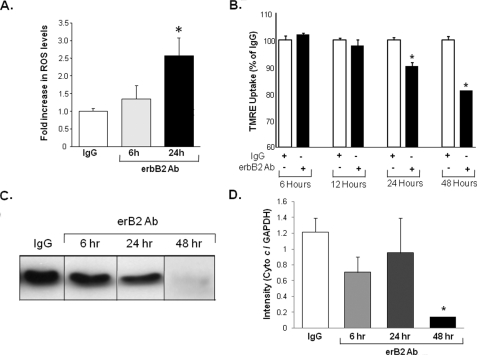
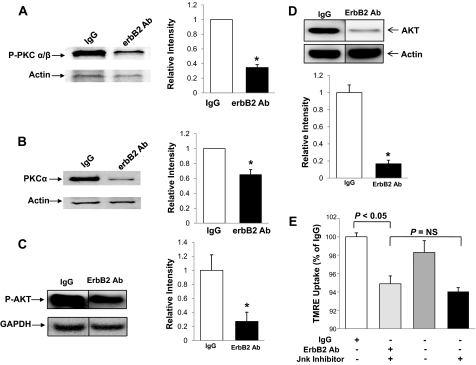
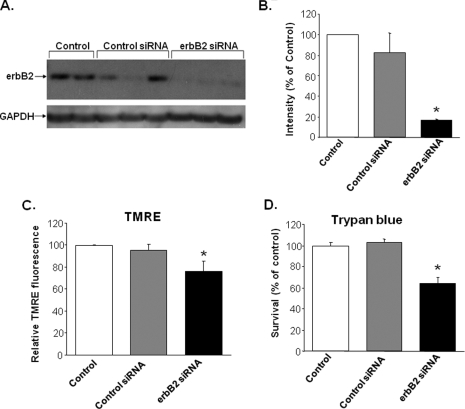
Overexpression of the receptor tyrosine kinase erbB2 (Her2 in humans) is correlated with a poor prognosis in breast and ovarian cancers. Treatment with trastuzumab (a monoclonal antibody against erbB2) improves survival; however, it also causes cardiomyopathy. We hypothesized that blockade of the erbB2 receptor induces cardiomyocyte death through a mitochondrial pathway that is dependent on the production of reactive oxygen species (ROS). We first showed that levels of erbB2 receptor are significantly decreased in an animal model of ischemic heart disease and in human ischemic cardiomyopathy. We treated neonatal rat cardiomyocytes with an inhibitory erbB2 antibody to study the mechanism behind the deleterious effects of erbB2 blockade. These cells displayed a dose-dependent increase in ROS production and cell death compared with control IgG-treated cells; these processes were reversed by the antioxidant, N-acetylcysteine. The effects of erbB2 antibody on both cell death and ROS production were also reversed by cyclosporine A and diazoxide, chemicals that regulate the pro- and anti-apoptotic channels in the mitochondria, respectively. Furthermore, mouse embryonic fibroblasts lacking Bax and Bak (proteins that mediate cell death through a mitochondrial pathway) were resistant to the deleterious effects of erbB2 antibody. These effects of erbB2 blockade appear to occur through a pathway involving AKT and PKC-alpha. Our results suggest that erbB2 plays a role in cardiomyocyte survival, and that the deleterious effects of trastuzumab on the heart occur through a mitochondrial pathway and is mediated by ROS production. Manipulation of redox signaling may be beneficial in cancer patients receiving trastuzumab.


Figures

FIGURE 1.
FIGURE 1.
Ischemia decreases the level of erbB2 protein in cardiomyocytes. A, Western blot with Her2 antibody on samples from normal human hearts (control) and from the hearts of patients with non-ischemic cardiomyopathy or ischemic cardiomyopathy. Four normal samples and five samples from ischemic and nonischemic cardiomyopathy patients were included in our studies. B, band densitometry was performed on the blot shown in A, and Her2 levels were normalized to actin levels (*, p = 0.011 versus control). C, Western blot for erbB2 protein levels in the hearts of dogs subjected to ischemia in the LCx artery for 2–5 h then immediately sacrificed. Tissue samples from the LCx (ischemic) and LAD (non-ischemic) territories were isolated along with similar samples from sham-instrumented (control) animals, which underwent all surgical procedures except coronary artery constriction, n = 3 in each group. D, quantification of erbB2 levels from Western blots similar to those shown in C. (*, p = 0.009 versus LAD). E, Western blot of NRCM treated with DMOG (a HIF-stabilizer) and control NRCM. F, quantification of erbB2 levels from the Western blots in E. DMOG treatment resulted in a significant decrease in the levels of erbB2 (*, p < 0.05 versus control). Band intensities were measured using ImageJ and normalized to the internal control (GAPDH or actin). Data are presented as mean ± S.E.
FIGURE 2.
FIGURE 2.
Treatment of NRCM with an erbB2 antibody increases ROS production, and the increase is blocked by treatment with NAC. NRCM were treated with 0.1 or 1 μg/ml of erbB2 antibody, and cell death was measured via (A) TMRE uptake (*, p = 0.017 and **, p = 0.029 compared with IgG, n ≥ 3) or (B) trypan-blue exclusion studies (*, p = 0.016 and **, p = 0.003 compared with IgG, n ≥ 3). C, ROS production was assessed by using confocal microscopy to visualize DCF (top panels, green fluorescence) and mitoSOX (bottom panels, red fluorescence) markers. The top panels were also stained with TMRE to identify mitochondria (red) and the bottom panels were stained with DAPI to identify nuclei (blue). D, quantification of ROS production in cells treated with rabbit pre-immune IgG (control) or erbB2 antibody for 18 h. ROS was detected by flow cytometry for DCF, and results were normalized to control cells treated with 1 μg/ml of IgG (*, p < 0.05 versus IgG; n ≥ 3). E, treatment with 10 mm NAC increases cell survival in the presence of erbB2 Ab. NRCM were treated with erbB2 Ab in the presence and absence of NAC, and viability was measured 24 h later via TMRE uptake (*, p = 0.007 versus IgG; #, p = 0.016 versus erbB2 Ab; n = 3). Data are presented as mean ± S.E.
FIGURE 3.
FIGURE 3.
erbB2-mediated signaling occurs through a mitochondria-dependent pathway. A, mitochondrial extracts from untreated (control) NRCM and from NRCM treated with erbB2 Ab were analyzed by Western blot with cyto c antibodies. ATP synthase (ATPase), a mitochondrial protein, was used as an internal control. B, NRCM were treated with erbB2 Ab in the presence and absence of the mPTP inhibitor CsA or the mitoKATP activator diazoxide, and viability was assayed via TMRE and flow cytometry. Both CsA and diazoxide reverse the deleterious effects of the erbB2 Ab (*, p = 0.007 versus IgG and **, p < 0.05 versus erbB2 Ab; n ≥ 3). The untreated (control) cells displayed in Fig. 2E were used as controls for this analysis. C, quantification of ROS production using the mitoSOX assay. *, p < 0.05 versus IgG and **, p < 0.05 versus erbB2 Ab; n ≥ 3. Data are presented as mean ± S.E.
FIGURE 4.
FIGURE 4.
erbB2 blockade requires Bax and Bak to induce cell death. A, Western blot showing erbB2 expression in WT and Bax/Bak DKO MEFs. Quantification of trypan blue exclusion in (B) WT and (C) DKO MEFS after treatment with erbB2 Ab. *, p = 6 × 10⁻⁴ for 1 μg and = 3 × 10⁻⁴ for 5 μg of erbB2 Ab versus IgG; n ≥ 3. Data are presented as mean ± S.E.
FIGURE 5.
FIGURE 5.
ROS production precedes dissipation of the MMP and mitochondrial cyto c release. A, the time course of ROS production in NRCM treated with erbB2 Ab or a control (IgG) Ab. Levels of ROS were measured with mitoSOX as described in Fig. 2. B, time course of TMRE uptake in NRCM treated with erbB2 Ab or a control (IgG) Ab. A partial reduction in TMRE uptake was observed 24 h after treatment, and uptake continued to decline at 48 h. C, Western blot of the mitochondrial fraction of NRCM treated with erbB2 Ab and probed with cyto c at different time points. D, quantification of cyto c levels in C (*, p < 0.05 versus control). Mitochondrial cyto c levels declined significantly 48 h after treatment. Band intensities were measured by using ImageJ and normalized to the internal control (actin). Data are presented as mean ± S.E.
FIGURE 6.
FIGURE 6.
erbB2 Ab-mediated signaling occurs through AKT- and PKCa-dependent pathways. A, Western blot (left) and quantification (right, normalized to actin levels) of phosphorylated PKCα levels in NRCM treated with erbB2 Ab or a control (IgG) Ab and probed with an antibody against the phosphorylated form of PKCα B, Western blot (left) and quantification (right, normalized to actin levels) of PKCα levels in NRCM treated with erbB2 Ab or a control (IgG) Ab and probed with a PKCα antibody. C, Western blot (left) and quantification (right, normalized to GAPDH levels) of phosphorylated AKT levels in NRCM treated with erbB2 Ab or a control (IgG) Ab and probed with an antibody against phosphorylated AKT. D, Western blot (top) and quantification (bottom, normalized to actin levels) of AKT levels in NRCM treated with erbB2 Ab or a control (IgG) Ab and probed with an AKT antibody. E, flow cytometry analyses of TMRE uptake in NRCM treated with erbB2 Ab or a control (IgG) Ab in the presence and absence of JNK inhibitor IX. *, p < 0.05 versus control; #, p < 0.05 versus erbB2 Ab treated cells; n = 3 in each group. Data are presented as mean ± S.E.
FIGURE 7.
FIGURE 7.
Treatment of NRCM with erbB2 siRNA increases cell death. A, Western blot of untreated (control) NRCM and NRCM treated with control siRNA or erbB2 siRNA. B, quantification of Western blot data from A normalized to GAPDH and expressed as a percentage of the control NRCM (*, p = 2 × 10⁻⁴ versus control siRNA; n = 3). C, flow cytometry analyses of TMRE uptake in untreated (control) NRCM and in NRCM treated with control siRNA or erbB2 siRNA (*, p = 0.028 versus control siRNA; n ≥ 3). D, trypan blue exclusion assays of untreated (control) NRCM and NRCM treated with control siRNA or erbB2 siRNA (*, p = 0.008 versus control siRNA; n ≥ 3). Data are presented as mean ± S.E.

References

    1. Groenen, L. C., Nice, E. C., and Burgess, A. W. (1994) Growth Factors 11 235–257 - PubMed
    1. Lemke, G. (1996) Mol. Cell Neurosci. 7 247–262 - PubMed
    1. Slamon, D. J., Clark, G. M., Wong, S. G., Levin, W. J., Ullrich, A., and McGuire, W. L. (1987) Science 235 177–182 - PubMed
    1. Slamon, D. J., Godolphin, W., Jones, L. A., Holt, J. A., Wong, S. G., Keith, D. E., Levin, W. J., Stuart, S. G., Udove, J., and Ullrich, A. (1989) Science 244 707–712 - PubMed
    1. Toikkanen, S., Helin, H., Isola, J., and Joensuu, H. (1992) J. Clin. Oncol. 10 1044–1048 - PubMed

Publication types

MeSH terms