. 2009 Feb 15;18(4):645-54.
doi: 10.1093/hmg/ddn394. Epub 2008 Nov 18.

Differential nuclear scaffold/matrix attachment marks expressed genes

Affiliations

Differential nuclear scaffold/matrix attachment marks expressed genes

Amelia K Linnemann et al. Hum Mol Genet. .

Abstract

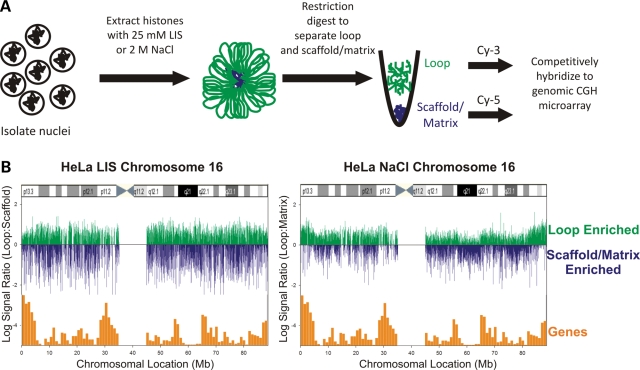
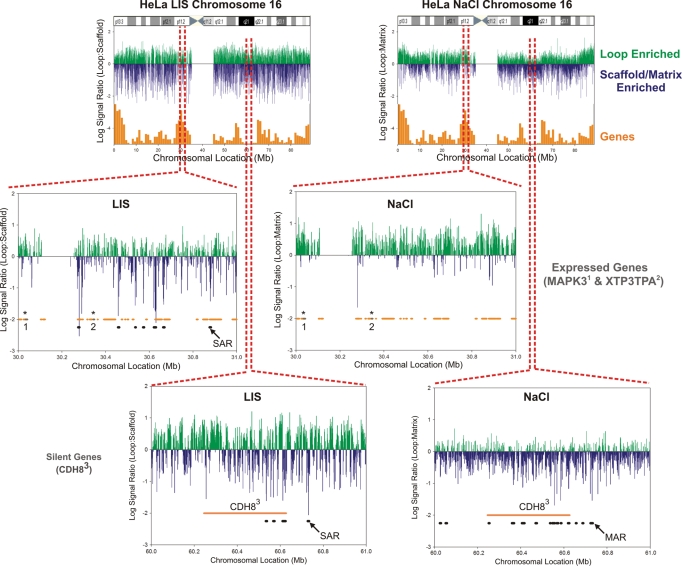
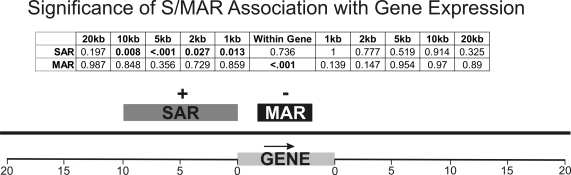
It is well established that nuclear architecture plays a key role in poising regions of the genome for transcription. This may be achieved using scaffold/matrix attachment regions (S/MARs) that establish loop domains. However, the relationship between changes in the physical structure of the genome as mediated by attachment to the nuclear scaffold/matrix and gene expression is not clearly understood. To define the role of S/MARs in organizing our genome and to resolve the often contradictory loci-specific studies, we have surveyed the S/MARs in HeLa S3 cells on human chromosomes 14-18 by array comparative genomic hybridization. Comparison of LIS (lithium 3,5-diiodosalicylate) extraction to identify SARs and 2 m NaCl extraction to identify MARs revealed that approximately one-half of the sites were in common. The results presented in this study suggest that SARs 5' of a gene are associated with transcript presence whereas MARs contained within a gene are associated with silenced genes. The varied functions of the S/MARs as revealed by the different extraction methods highlights their unique functional contribution.


Figures

Figure 1.
Figure 1.
Nuclear Scaffold/Matrix extraction reveals isolation specific differences. (A) Isolation of loop and scaffold/matrix DNA. (B) HeLa log2 CGH signal ratios of LIS isolated loop:scaffold and NaCl-isolated loop:matrix fractions. The log2 CGH ratios are indicated as bars along chromosome 16. Loop regions (green) are indicated as positive signals, whereas nuclear scaffold/matrix-associated regions (blue) are represented as negative signals respective of the zero axis. Gene density (orange bars) and an ideogram representative of G-banding were then overlaid along the chromosome. The NaCl-extracted nuclear matrix revealed global chromatin organization such that gene density correlated with looping. It is apparent that the LIS-isolated nuclear scaffold organizes the chromosome in a different manner.
Figure 2.
Figure 2.
Spacing of S/MARs along human chromosome 16. The binned distance between S/MARs on human chromosome 16 is shown for nuclear scaffolds/matrices isolated by LIS or NaCl extraction with the peak distance averages for each indicated. The frequency of both SAR and MAR spacing shows a bimodal distribution with two groups of average inferred loop sizes at 558 bp and ∼88 kb for SARs and 762 bp and ∼94 kb for MARs.
Figure 3.
Figure 3.
Intergenic nuclear scaffold/matrix attachment and expression. SARs and MARs were mapped according to their distance from both the 5′ and 3′ ends of genes on chromosome 16. Analysis of intergenic S/MAR distance from all genes reveals similar overall distributions from LIS and NaCl extractions.
Figure 4.
Figure 4.
LIS and NaCl extractions reveal different profiles relative to gene density/expression. The nuclear scaffold/matrix aCGH profiles in a 30–31 Mb, 16p11.2 gene-rich and 60–61 Mb, 16q21 gene-poor region are shown Log2 loop enrichment is indicated in green and scaffold/matrix association in blue. Regions identified as S/MARs (black bars) were compared with orange: silent and gray: expressed genes (indicated by asterisks). Gene-dense regions show little, if any nuclear matrix attachment and rather are bound to a LIS extracted nuclear scaffold. Gene-poor regions show significant nuclear matrix attachment with fewer-attachment sites to the LIS-isolated nuclear scaffold.
Figure 5.
Figure 5.
SAR and MAR correlations with gene expression. The presence of S/MARs encompassing 20 kb region 5′ and 3′ of a gene, as well as within genes was compared with transcript presence using chi-square analysis (95% CI, 1 df with Yate's correction). The resulting P-values are displayed for each measurement with significance <0.05 indicated in bold. A SAR within 10 kb of the 5′ end region of a gene significantly correlates with gene expression. In contrast a MAR within a gene correlates with silencing of that gene. Direction of transcription is indicated by the arrow.

References

    1. Cremer T., Cremer C. Chromosome territories, nuclear architecture and gene regulation in mammalian cells. Nat. Rev. Genet. 2001;2:292–301. - PubMed
    1. Volpi E.V., Chevret E., Jones T., Vatcheva R., Williamson J., Beck S., Campbell R.D., Goldsworthy M., Powis S.H., Ragoussis J., et al. Large-scale chromatin organization of the major histocompatibility complex and other regions of human chromosome 6 and its response to interferon in interphase nuclei. J. Cell Sci. 2000;113(Pt):1565–1576. - PubMed
    1. Mahy N.L., Perry P.E., Bickmore W.A. Gene density and transcription influence the localization of chromatin outside of chromosome territories detectable by FISH. J. Cell Biol. 2002;159:753–763. - PMC - PubMed
    1. Albiez H., Cremer M., Tiberi C., Vecchio L., Schermelleh L., Dittrich S., Kupper K., Joffe B., Thormeyer T., von Hase J., et al. Chromatin domains and the interchromatin compartment form structurally defined and functionally interacting nuclear networks. Chromosome Res. 2006;14:707–733. - PubMed
    1. Bode J., Benham C., Knopp A., Mielke C. Transcriptional augmentation: modulation of gene expression by scaffold/matrix-attached regions (S/MAR elements) Crit. Rev. Eukaryot. Gene Expr. 2000;10:73–90. - PubMed

Publication types

Associated data