

Creatine synthesis: hepatic metabolism of guanidinoacetate and creatine in the rat in vitro and in vivo
- PMID: 19017728
- PMCID: PMC2645018
- DOI: 10.1152/ajpendo.90547.2008
Creatine synthesis: hepatic metabolism of guanidinoacetate and creatine in the rat in vitro and in vivo
Abstract
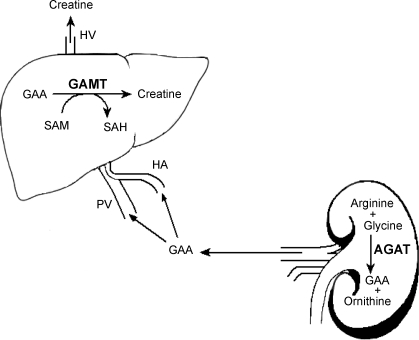
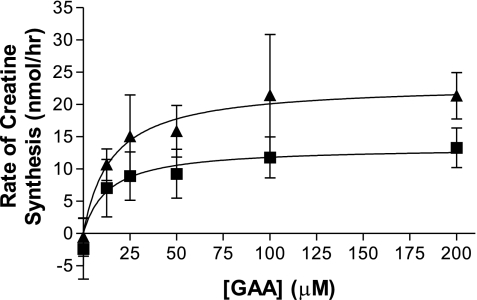
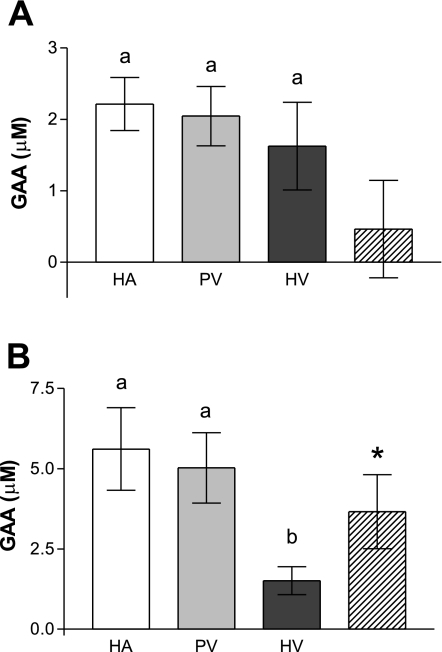
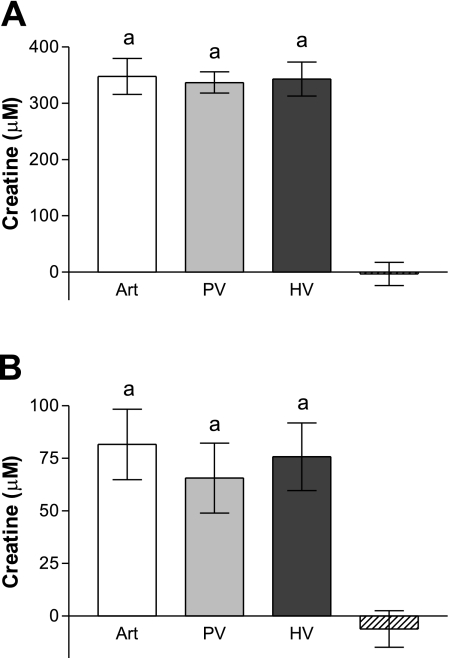
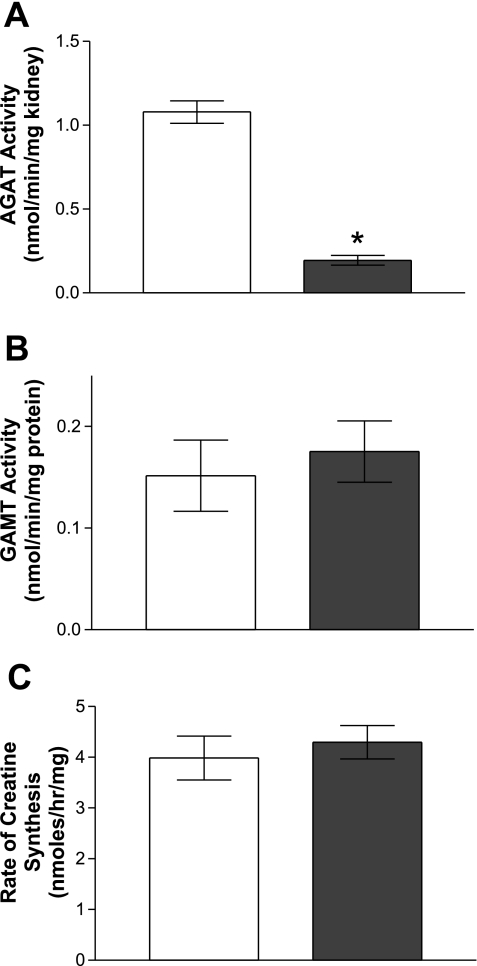
Since creatinine excretion reflects a continuous loss of creatine and creatine phosphate, there is a need for creatine replacement, from the diet and/or by de novo synthesis. Creatine synthesis requires three amino acids, methionine, glycine, and arginine, and two enzymes, l-arginine:glycine amidinotransferase (AGAT), which produces guanidinoacetate acid (GAA), and guanidinoacetate methyltransferase (GAMT), which methylates GAA to produce creatine. In the rat, high activities of AGAT are found in the kidney, whereas high activities of GAMT occur in the liver. Rat hepatocytes readily convert GAA to creatine; this synthesis is stimulated by the addition of methionine, which increases cellular S-adenosylmethionine concentrations. These same hepatocytes are unable to produce creatine from methionine, arginine, and glycine. (15)N from (15)NH(4)Cl is readily incorporated into urea but not into creatine. Hepatic uptake of GAA is evident in vivo by livers of rats fed a creatine-free diet but not when rats were fed a creatine-supplemented diet. Rats fed the creatine-supplemented diet had greatly decreased renal AGAT activity and greatly decreased plasma [GAA] but no decrease in hepatic GAMT or in the capacity of hepatocytes to produce creatine from GAA. These studies indicate that hepatocytes are incapable of the entire synthesis of creatine but are capable of producing it from GAA. They also illustrate the interplay between the dietary provision of creatine and its de novo synthesis and point to the crucial role of renal AGAT expression in regulating creatine synthesis in the rat.
Figures
References
-
- Bessman SP, Carpenter CL. The creatine-creatine phosphate energy shuttle. Annu Rev Biochem 54: 831–862, 1985. - PubMed
-
- Braissant O, Henry H. AGAT, GAMT and SLC6A8 distribution in the central nervous system, in relation to creatine deficiency syndromes: a review. J Inherit Metab Dis 31: 230–239, 2008. - PubMed
-
- Brosnan JT, Brosnan ME. Creatine: endogenous metabolite, dietary, and therapeutic supplement. Annu Rev Nutr 27: 241–261, 2007. - PubMed
-
- Brosnan JT, Brosnan ME, Yudkoff M, Nissim I, Daikhin Y, Lazarow A, Horyn O, Nissim I. Alanine metabolism in the perfused rat liver. Studies with 15N. J Biol Chem 276: 31876–31882, 2001. - PubMed
Publication types
MeSH terms
Substances
Grants and funding
LinkOut - more resources
Full Text Sources
Medical
Miscellaneous