

Intergenerational transmission of glucose intolerance and obesity by in utero undernutrition in mice
- PMID: 19017762
- PMCID: PMC2628621
- DOI: 10.2337/db08-0490
Intergenerational transmission of glucose intolerance and obesity by in utero undernutrition in mice
Abstract
Objective: Low birth weight (LBW) is associated with increased risk of obesity, diabetes, and cardiovascular disease during adult life. Moreover, this programmed disease risk can progress to subsequent generations. We previously described a mouse model of LBW, produced by maternal caloric undernutrition (UN) during late gestation. LBW offspring (F(1)-UN generation) develop progressive obesity and impaired glucose tolerance (IGT) with aging. We aimed to determine whether such metabolic phenotypes can be transmitted to subsequent generations in an experimental model, even in the absence of altered nutrition during the second pregnancy.
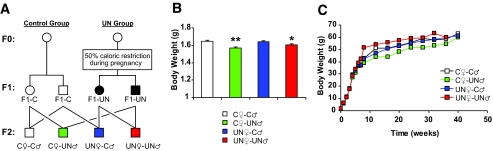
Research design and methods: We intercrossed female and male F(1) adult control (C) and UN mice and characterized metabolic phenotypes in F(2) offspring.
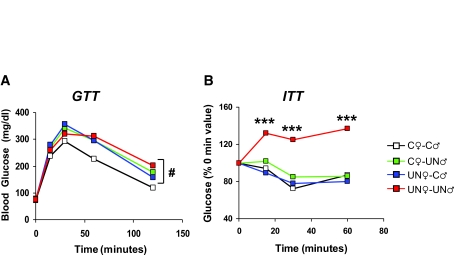
Results: We demonstrate that 1) reduced birth weight progresses to F(2) offspring through the paternal line (Cfemale -Cmale = 1.64 g; Cfemale -UNmale = 1.57 g, P < 0.05; UNfemale -Cmale = 1.64 g; UNfemale -UNmale = 1.60 g, P < 0.05), 2) obesity progresses through the maternal line (percent body fat: Cfemale -Cmale = 22.4%; Cfemale -UNmale = 22.9%; UNfemale -Cmale = 25.9%, P < 0.05; UNfemale -UNmale = 27.5%, P < 0.05), and 3) IGT progresses through both parental lineages (glucose tolerance test area under curve Cfemale -Cmale = 100; Cfemale -UNmale = 122, P < 0.05; UNfemale -Cmale = 131, P < 0.05; UNfemale -UNmale = 151, P < 0.05). Mechanistically, IGT in both F(1) and F(2) generations is linked to impaired beta-cell function, explained, in part, by dysregulation of Sur1 expression.
Conclusions: Maternal undernutrition during pregnancy (F(0)) programs reduced birth weight, IGT, and obesity in both first- and second-generation offspring. Sex-specific transmission of phenotypes implicates complex mechanisms including alterations in the maternal metabolic environment (transmaternal inheritance of obesity), gene expression mediated by developmental and epigenetic pathways (transpaternal inheritance of LBW), or both (IGT).
Figures
 , 5.5 mmol/l;
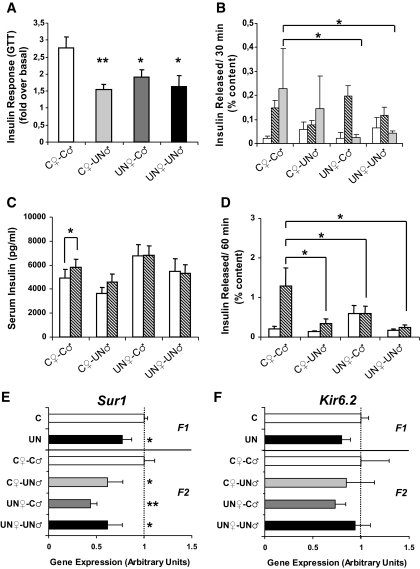
  , 16.7 mmol/l. C: Intraperitoneal tolbutamide tolerance test (1 mg tolbutamide/kg body wt) was performed after a 4-h fast on 4-month-old mice (n ≥ 8 mice/group). □, 0 min; 30 min tolbutamide. D: Tolbutamide stimulation (200 μmol/l) of insulin release from isolated islets ex vivo (n ≥ 4 replicates/group in at least 2 independent isolations). □, none; tolbutamide. E: Sur1 gene expression was assessed by quantitative PCR in islets from 4-month-old mice (n ≥ 5 replicates/group). F: Kir6.2 gene expression was assessed by quantitative PCR in islets from 4-month-old mice (n ≥ 5 replicates/group). For all panels, results are expressed as means ± SE. *P < 0.05 vs. C♀-C♂; **P < 0.01 vs. C♀-C♂ (ANOVA).
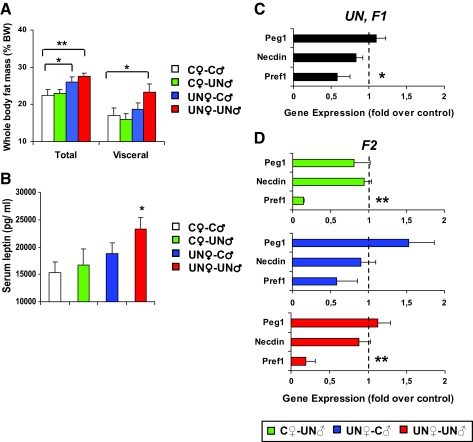
References
-
- Hales CN, Barker DJ: Type 2 (non-insulin-dependent) diabetes mellitus: the thrifty phenotype hypothesis. Diabetologia 35: 595–601, 1992 - PubMed
-
- Barker DJ: In utero programming of chronic disease. Clin Sci (Lond) 95: 115–128, 1998 - PubMed
-
- McMillen IC, Robinson JS: Developmental origins of the metabolic syndrome: prediction, plasticity, and programming. Physiol Rev 85: 571–633, 2005 - PubMed
-
- Saenger P, Czernichow P, Hughes I, Reiter EO: Small for gestational age: short stature and beyond. Endocr Rev 28: 219–251, 2007 - PubMed
Publication types
MeSH terms
Grants and funding
LinkOut - more resources
Full Text Sources
Medical
Miscellaneous
