

Ocean methane hydrates as a slow tipping point in the global carbon cycle
- PMID: 19017807
- PMCID: PMC2584575
- DOI: 10.1073/pnas.0800885105
Ocean methane hydrates as a slow tipping point in the global carbon cycle
Abstract
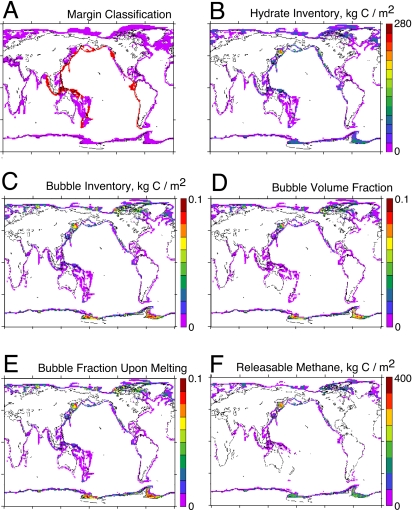
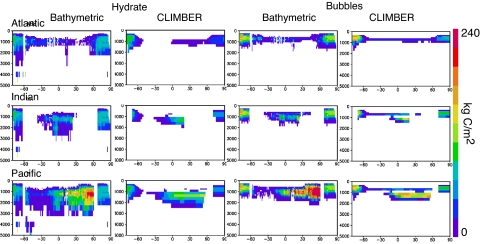
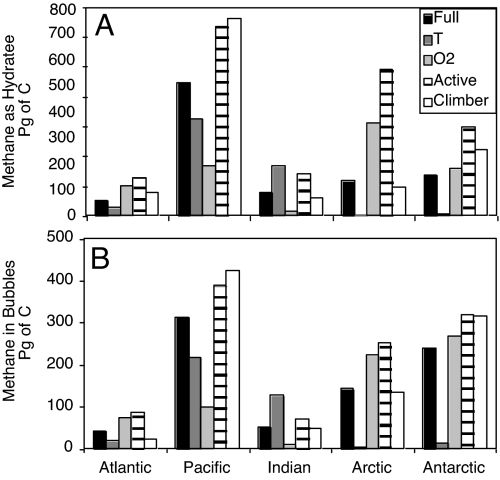
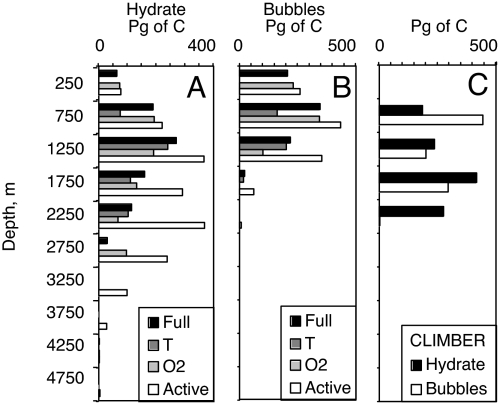
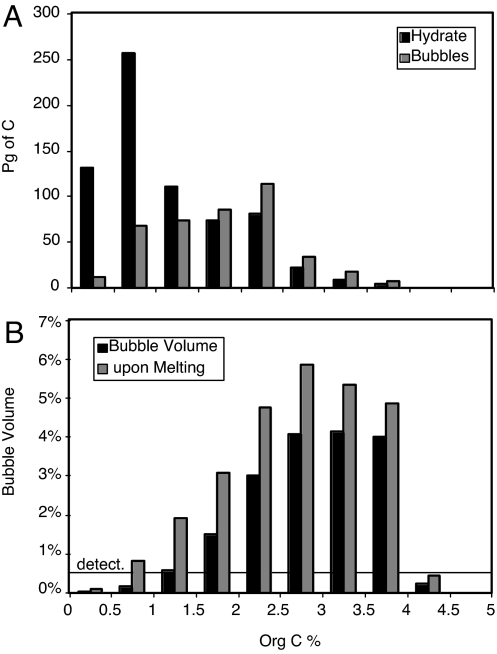
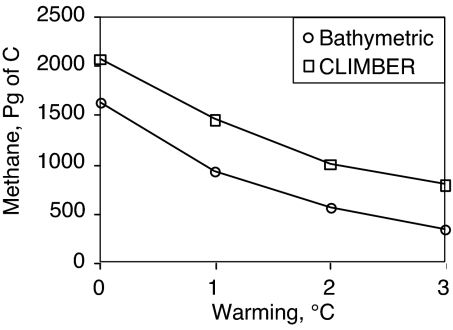
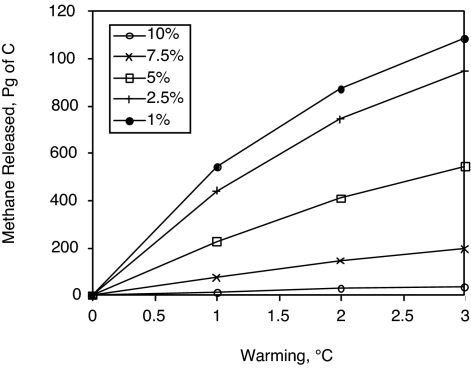
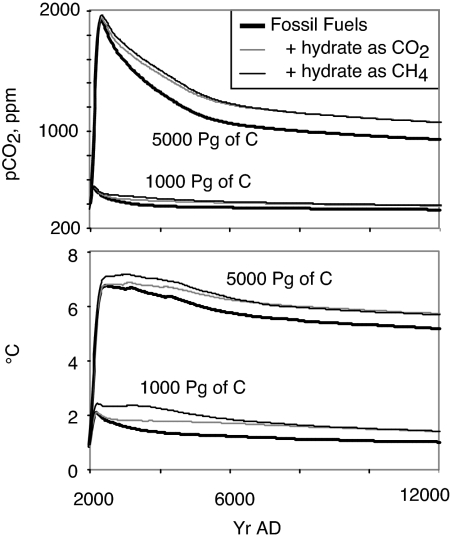
We present a model of the global methane inventory as hydrate and bubbles below the sea floor. The model predicts the inventory of CH(4) in the ocean today to be approximately 1600-2,000 Pg of C. Most of the hydrate in the model is in the Pacific, in large part because lower oxygen levels enhance the preservation of organic carbon. Because the oxygen concentration today may be different from the long-term average, the sensitivity of the model to O(2) is a source of uncertainty in predicting hydrate inventories. Cold water column temperatures in the high latitudes lead to buildup of hydrates in the Arctic and Antarctic at shallower depths than is possible in low latitudes. A critical bubble volume fraction threshold has been proposed as a critical threshold at which gas migrates all through the sediment column. Our model lacks many factors that lead to heterogeneity in the real hydrate reservoir in the ocean, such as preferential hydrate formation in sandy sediments and subsurface gas migration, and is therefore conservative in its prediction of releasable methane, finding only 35 Pg of C released after 3 degrees C of uniform warming by using a 10% critical bubble volume. If 2.5% bubble volume is taken as critical, then 940 Pg of C might escape in response to 3 degrees C warming. This hydrate model embedded into a global climate model predicts approximately 0.4-0.5 degrees C additional warming from the hydrate response to fossil fuel CO(2) release, initially because of methane, but persisting through the 10-kyr duration of the simulations because of the CO(2) oxidation product of methane.
Conflict of interest statement
The authors declare no conflict of interest.
Figures
References
-
- Kvenvolden KA. Gas Hydrates - Geological Perspective and Global Change. Rev Geophys. 1993;31:173–187.
-
- Milkov AV. Global estimates of hydrate-bound gas in marine sediments: How much is really out there? Earth-Sci Rev. 2004;66:183–197.
-
- Buffett B, Archer DE. Global inventory of methane clathrate: Sensitivity to changes in the deep ocean. Earth Planet Sci Lett. 2004;227:185–199.
-
- Dickens GR, O'Heill JR, Rea DK, Owens RM. Dissociation of oceanic methane hydrate as a cause of the carbon isotope excursion at the end of the Paleocene. Paleoceanography. 1995;19:965–971.
-
- Kennett JP, Cannariato KG, Hendy IL, Behl RJ. Carbon isotopic evidence for methane hydrate instability during quaternary interstadials. Science. 2000;288:128–133. - PubMed
Publication types
LinkOut - more resources
Full Text Sources
