

Protein microarray analysis in patients with asthma: elevation of the chemokine PARC/CCL18 in sputum
- PMID: 19017877
- PMCID: PMC2835338
- DOI: 10.1378/chest.08-0962
Protein microarray analysis in patients with asthma: elevation of the chemokine PARC/CCL18 in sputum
Abstract
Background: Microarray technology offers a new opportunity to gain insight into global gene and protein expression profiles in asthma. To identify novel factors produced in the asthmatic airway, we analyzed sputum samples by using a membrane-based human cytokine microarray technology in patients with bronchial asthma (BA).
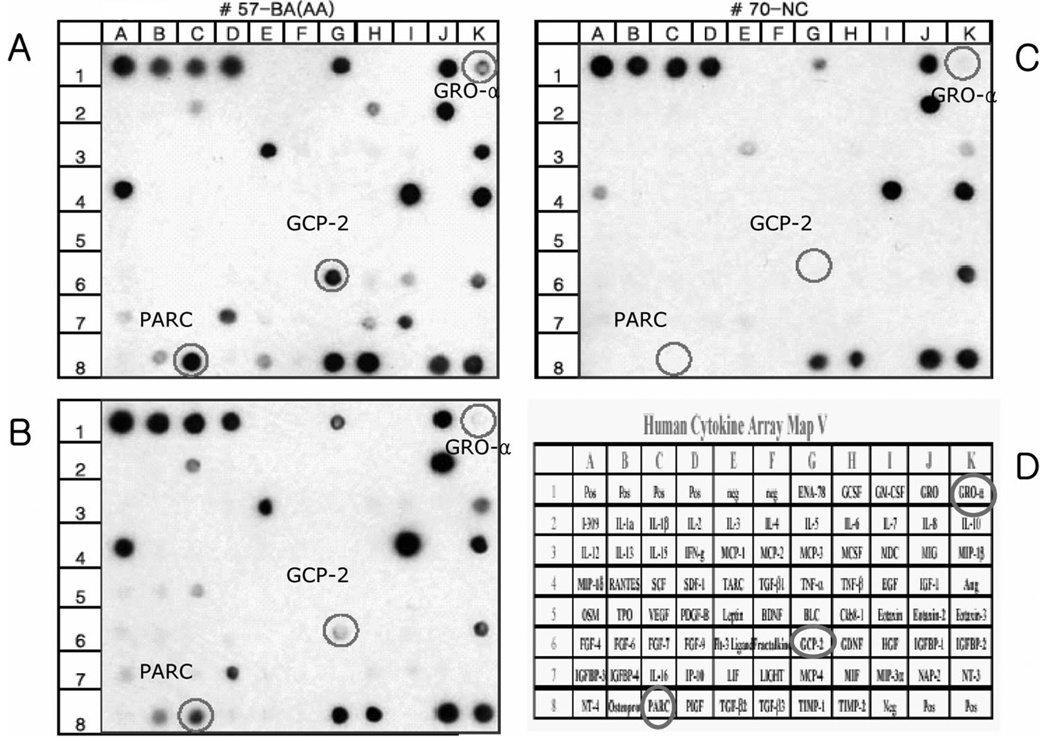
Methods: Induced sputum was obtained from 28 BA subjects, 20 nonasthmatic atopic control (AC) subjects, and 38 nonasthmatic nonatopic normal control (NC) subjects. The microarray samples of subjects were randomly selected from nine BA subjects, three AC subjects, and six NC subjects. Sputum supernatants were analyzed using a custom human cytokine array (RayBio Custom Human Cytokine Array; RayBiotech; Norcross, GA) designed to analyze 79 specific cytokines simultaneously. The levels of growth-regulated oncogene (GRO)-alpha, eotaxin-2, and pulmonary and activation-regulated chemokine (PARC)/CCL18 were measured by sandwich enzyme-linked immunosorbent assays (ELISAs), and eosinophil-derived neurotoxin (EDN) was measured by radioimmunoassay.
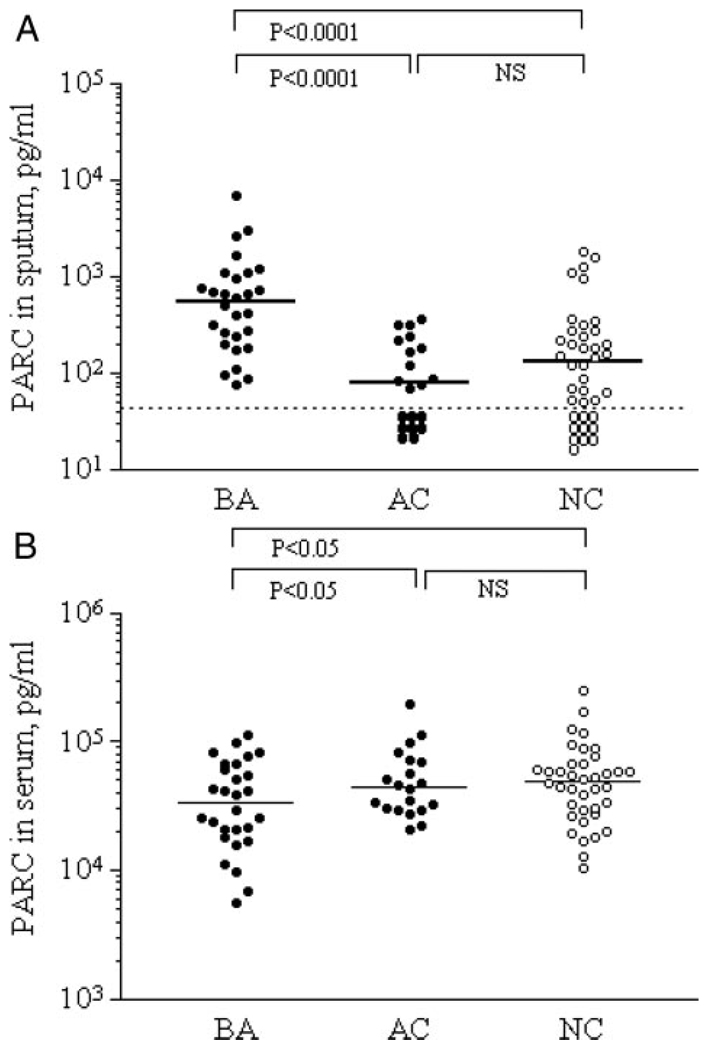
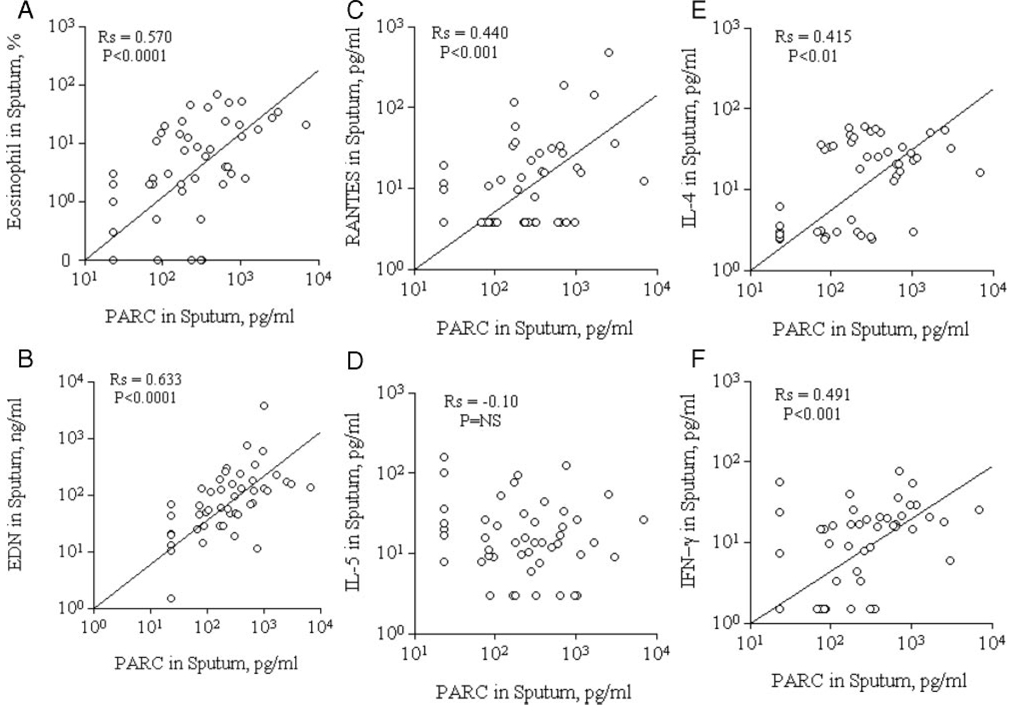
Results: By microarray, the signal intensities for GRO-alpha, eotaxin-2, and PARC were significantly higher in BA subjects than in AC and NC subjects (p = 0.036, p = 0.042, and p = 0.033, respectively). By ELISA, the sputum PARC protein levels were significantly higher in BA subjects than in AC and NC subjects (p < 0.0001). Furthermore, PARC levels correlated significantly with sputum eosinophil percentages (r = 0.570, p < 0.0001) and the levels of EDN (r = 0.633, p < 0.0001), the regulated upon activation, normal T cell expressed and secreted cytokine (r = 0.440, p < 0.001), interleukin-4 (r = 0.415, p < 0.01), and interferon-gamma (r = 0.491, p < 0.001).
Conclusions: By a nonbiased screening approach, a chemokine, PARC, is elevated in sputum specimens from patients with asthma. PARC may play important roles in development of airway eosinophilic inflammation in asthma.
Conflict of interest statement
The authors have reported to the ACCP that no significant conflicts of interest exist with any companies/organizations whose products or services may be discussed in this article.
Figures
Similar articles
-
Eotaxin-2 in sputum cell culture to evaluate asthma inflammation.Eur Respir J. 2007 Mar;29(3):489-95. doi: 10.1183/09031936.00060205. Epub 2006 Nov 1. Eur Respir J. 2007. PMID: 17079258
-
[Eotaxin in induced sputum in patients with asthma and chronic bronchitis: relationship with airway inflammation].Zhonghua Jie He He Hu Xi Za Zhi. 2002 Jan;25(1):29-32. Zhonghua Jie He He Hu Xi Za Zhi. 2002. PMID: 11953096 Chinese.
-
Epithelial eotaxin-2 and eotaxin-3 expression: relation to asthma severity, luminal eosinophilia and age at onset.Thorax. 2012 Dec;67(12):1061-6. doi: 10.1136/thoraxjnl-2012-201634. Epub 2012 Sep 26. Thorax. 2012. PMID: 23015684 Free PMC article.
-
Smoking affects eotaxin levels in asthma patients.J Asthma. 2009 Jun;46(5):470-6. doi: 10.1080/02770900902846349. J Asthma. 2009. PMID: 19544167
-
Contribution of eotaxin-1 to eosinophil chemotactic activity of moderate and severe asthmatic sputum.Am J Respir Crit Care Med. 2004 May 15;169(10):1110-7. doi: 10.1164/rccm.200306-855OC. Epub 2004 Mar 4. Am J Respir Crit Care Med. 2004. PMID: 15001461
Cited by
-
Infection, eosinophilia and childhood asthma.Asia Pac Allergy. 2012 Jan;2(1):3-14. doi: 10.5415/apallergy.2012.2.1.3. Epub 2012 Jan 31. Asia Pac Allergy. 2012. PMID: 22348202 Free PMC article.
-
Segmental allergen challenge enhances chitinase activity and levels of CCL18 in mild atopic asthma.Clin Exp Allergy. 2013 Feb;43(2):187-97. doi: 10.1111/cea.12032. Clin Exp Allergy. 2013. PMID: 23331560 Free PMC article.
-
Quiescent and Active Tear Protein Profiles to Predict Vernal Keratoconjunctivitis Reactivation.Biomed Res Int. 2016;2016:9672082. doi: 10.1155/2016/9672082. Epub 2016 Feb 17. Biomed Res Int. 2016. PMID: 26989694 Free PMC article. Clinical Trial.
-
Deciphering Asthma Biomarkers with Protein Profiling Technology.Int J Inflam. 2015;2015:630637. doi: 10.1155/2015/630637. Epub 2015 Aug 6. Int J Inflam. 2015. PMID: 26346739 Free PMC article. Review.
-
Relationship between chemokines and T lymphocytes in the context of respiratory allergies (Review).Exp Ther Med. 2020 Sep;20(3):2352-2360. doi: 10.3892/etm.2020.8961. Epub 2020 Jun 29. Exp Ther Med. 2020. PMID: 32765714 Free PMC article. Review.
References
-
- Pizzichini E, Pizzichini MM, Efthimiadis A, et al. Indices of airway inflammation in induced sputum: reproducibility and validity of cell and fluid-phase measurements. Am J Respir Crit Care Med. 1996;154:308–317. - PubMed
-
- Spanevello A, Migliori GB, Sharara A, et al. Induced sputum to assess airway inflammation: a study of reproducibility. Clin Exp Allergy. 1997;27:1138–1144. - PubMed
-
- Claman DM, Boushey HA, Liu J, et al. Analysis of induced sputum to examine the effects of prednisone on airway inflammation in asthmatic subjects. J Allergy Clin Immunol. 1994;94:861–869. - PubMed
-
- MacBeath G. Protein microarrays and proteomics. Nat Genet. 2002;32:S526–S532. - PubMed
-
- Fahy JV, Liu J, Wong H, et al. Cellular and biochemical analysis of induced sputum from asthmatic and from healthy subjects. Am Rev Respir Dis. 1993;147:1126–1131. - PubMed
Publication types
MeSH terms
Substances
Grants and funding
LinkOut - more resources
Full Text Sources
Other Literature Sources
Medical
