Multicenter Study
. 2008 Dec 1;181(11):8145-52.
doi: 10.4049/jimmunol.181.11.8145.

Differential expression and molecular associations of Syk in systemic lupus erythematosus T cells

Affiliations
Multicenter Study

Differential expression and molecular associations of Syk in systemic lupus erythematosus T cells

Sandeep Krishnan et al. J Immunol. .

Abstract

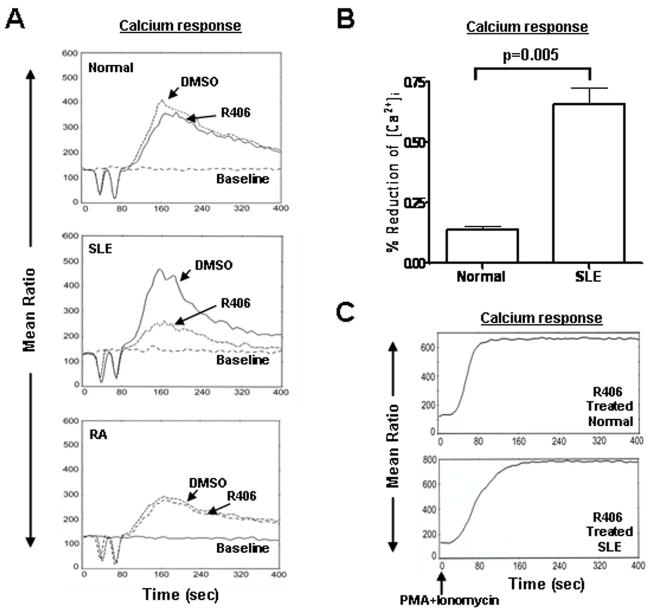
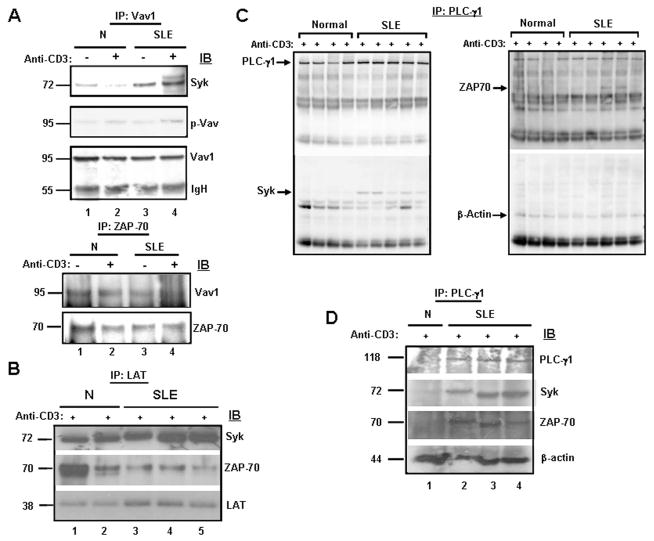
Diminished expression of TCR zeta and reciprocal up-regulation and association of FcRgamma with the TCR/CD3 complex is a hallmark of systemic lupus erythematosus (SLE) T cells. In this study we explored whether differential molecular associations of the spleen tyrosine kinase Syk that preferentially binds to FcRgamma contribute to pathological amplification of signals downstream of this "rewired TCR" in SLE. We detected higher amounts of Syk expression and activity in SLE compared with normal T cells. Selective inhibition of the activity of Syk reduced the strength of TCR-induced calcium responses and slowed the rapid kinetics of actin polymerization exclusively in SLE T cells. Syk and ZAP-70 also associated differently with key molecules involved in cytoskeletal and calcium signaling in SLE T cells. Thus, while Vav-1 and LAT preferentially bound to Syk, phospholipase C-gamma1 bound to both Syk and ZAP-70. Our results show that differential associations of Syk family kinases contribute to the enhanced TCR-induced signaling responses in SLE T cells. Thus, we propose molecular targeting of Syk as a measure to control abnormal T cell responses in SLE.


Figures

Fig. 1
Fig. 1. Expression and activity of Syk are increased in SLE T cells
A. Western blot of 2 μg of proteins derived from normal and SLE T cells and resolved on a 4–12% Bis-Tris Nupage (Invitrogen), blotted to PVDF membrane and probed with anti-Syk and β-actin Abs. B. Similar blot probed with anti-ZAP-70 antibody. The graphs in the bottom panel show the ratio of Syk:Actin of densitometric values. *, P<0.05 by student t test. C. Western blot of lysates derived from normal, RA and SS cells, probed with Syk, ZAP-70 and β-actin Abs. D. Normal or SLE T cells were stimulated with an IgM anti-CD3 antibody for 15 and 30 seconds. Representative and cumulative data are shown. N, normal; L, SLE.
Fig. 2
Fig. 2. Differential involvement of Syk in phosphorylation of cytoplasmic proteins and differential localization of Syk kinases in normal and SLE T cells
A. Normal and SLE T cells were either left untreated or treated with 2 μM R406 for 1 h at 37 C. Subsequently the cells were activated as shown with anti-CD3 IgM Ab and lysed in a buffer containing 1% Triton-X 100. Two micrograms of proteins were loaded and resolved on a 4–12% Bis-Tris Nupage (Invitrogen), transferred to PVDF membrane and the blot probed with anti-phosphotyrosine antibody (4G10, Upstate biotech). Bottom panel shows stripping and reprobing the blot with anti-β-actin Abs. n=4 for normal, n=4 for SLE B. The blots from the above experiments were stripped and reprobed with anti-TCRζ antibody that recognizes both 16 kDa and 21/23 kDa chains. C. Two million normal and SLE T cells were activated as above, lysed in a lysis buffer containing 1% Triton-X 100 and the proteins eluted from the detergent insoluble pellet by treating with cytochalasin B as described in Materials and Methods. Two micrograms of proteins derived from the lysates were resolved on a gel and probed with anti-Syk and anti-ZAP-70 Abs. n=4 for normal, n=4 for SLE.
Fig. 3
Fig. 3. Inhibition of Syk kinase by R406 retards actin-polymerization
One million normal, SLE and RA T cells were treated with either DMSO or 2 μM R406 for 1 h at 37°C and then stimulated with anti-CD3 IgM-Ab for 10, 20, 30, 60 or 120s and then fixed with 2% paraformaldehyde. Cells were then stained with Phalloidin-FITC for 30 min and analyzed by FACS. In order to plot this graph, the mean fluorescence intensity (MFI) of peak actin polymerization (phalloidin staining intensity) at 60s and 30s were first obtained using the Cellquest FACS software. The shifts in the peak values between 30 and 60s were plotted as the ratios of peak actin polymerization at 60 s and 30 s in different treatment groups. n=5 for both normal and SLE T cells and n=3 for RA cells. Statistics were done using Student t test.
Fig. 4
Fig. 4. Inhibition of Syk kinase by R406 dampens TCR-induced calcium response in SLE T cells
A.One million normal, SLE and RA T cells were treated with either DMSO or 2 μM R406 for 1 h at 37°C and loaded with indo-AM, and calcium flux in response to stimulus with anti-CD3 (OKT3) was analyzed for 400 s using Epics Altra (Coulter, Hialeah, FL). B. The graph shows the percent reduction of peak calcium response calculated as the difference in the heights of peak calcium response to DMSO and R406 treatment divided by the height of peak calcium response to DMSO treatment. n=3 for normal; n=4 for SLE and RA cells. C. Normal and SLE T cells treated with R406 as described above were further treated with PMA and ionomycin and the pattern of calcium flux was studied.
Fig. 5
Fig. 5. Differential association of Syk with Vav, LAT and PLC γ1 in SLE and normal T cells
A-DOne hundred micrograms of proteins derived from lysis of normal or SLE T cells were subjected to immunoprecipitation with antibodies against signaling proteins as indicated in the figure. The samples were resolved on a 4–12% Bis-tris gel and blotted to PVDF membranes and the blot probed with antibodies against individual proteins as shown on the side of each panel. IP=Immunoprecipitation; IB=Immunoblot; IgH, Ig heavy chain; N, normal T cells; SLE, SLE T cells. In order to calculate P values, densitometric ratios were subjected to Student t test.

References

    1. Kammer GM, Perl A, Richardson BC, Tsokos GC. Abnormal T cell signal transduction in systemic lupus erythematosus. Arthritis Rheum. 2002;46:1139–1154. - PubMed
    1. Kong PL, Odegard JM, Bouzahzah F, Choi JY, Eardley LD, Zielinski CE, Craft JE. Intrinsic T cell defects in systemic autoimmunity. Ann NY Acad Sci. 2003;987:60–67. - PubMed
    1. Liossis SN, Ding XZ, Dennis GJ, Tsokos GC. Altered pattern of TCR/CD3-mediated protein-tyrosyl phosphorylation in T cells from patients with systemic lupus erythematosus. Deficient expression of the T cell receptor zeta chain. J Clin Invest. 1998;101:1448–1457. - PMC - PubMed
    1. Krishnan S, Nambiar MP, Warke VG, Fisher CU, Mitchell J, Delaney N, Tsokos GC. Alterations in lipid raft composition and dynamics contribute to abnormal T cell responses in systemic lupus erythematosus. J Immunol. 2004;172:7821–7831. - PubMed
    1. Enyedy EJ, Nambiar MP, Liossis SN, Dennis G, Kammer GM, Tsokos GC. Fc epsilon receptor type I gamma chain replaces the deficient T cell receptor zeta chain in T cells of patients with systemic lupus erythematosus. Arthritis Rheum. 2001;44:1114–1121. - PubMed

Publication types

MeSH terms