. 2008 Dec;64(Pt 12):1210-21.
doi: 10.1107/S0907444908030564. Epub 2008 Nov 18.

New paradigm for macromolecular crystallography experiments at SSRL: automated crystal screening and remote data collection

Affiliations

New paradigm for macromolecular crystallography experiments at SSRL: automated crystal screening and remote data collection

S Michael Soltis et al. Acta Crystallogr D Biol Crystallogr. 2008 Dec.

Abstract

Complete automation of the macromolecular crystallography experiment has been achieved at SSRL through the combination of robust mechanized experimental hardware and a flexible control system with an intuitive user interface. These highly reliable systems have enabled crystallography experiments to be carried out from the researchers' home institutions and other remote locations while retaining complete control over even the most challenging systems. A breakthrough component of the system, the Stanford Auto-Mounter (SAM), has enabled the efficient mounting of cryocooled samples without human intervention. Taking advantage of this automation, researchers have successfully screened more than 200 000 samples to select the crystals with the best diffraction quality for data collection as well as to determine optimal crystallization and cryocooling conditions. These systems, which have been deployed on all SSRL macromolecular crystallography beamlines and several beamlines worldwide, are used by more than 80 research groups in remote locations, establishing a new paradigm for macromolecular crystallography experimentation.


Figures
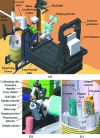
Figure 1
Figure 1
(a) Schematic of the standard experimental hardware in the experimental hutches. (b) An expanded view of the vicinity around the sample position. (c) An expanded view of the robot dispensing Dewar. All critical components are motorized and remotely controlled.
Figure 2
Figure 2
The Distributed Control System (DCS) three-tier message-passing architecture. The DCS server (DCSS) communicates with the GUI and the Hardware layers via TCP/IP on a gigabit network. This architecture enables multiple GUI connections to DCSS and allows DCSS to run data collection or crystal screening decoupled from the Blu-Ice user interface, increasing the uptime and efficiency of the beamline. Hardware running on potentially different computing platforms and control systems ‘plug in’ at the Hardware layer. These services are typically protected on a private network.
Figure 3
Figure 3
The Hutch tab in the tab-based experimental interface Blu-Ice. Researchers can set experimental parameters and align samples using this intuitive interface. The diffraction resolution of the experimental equipment is updated as the parameters are entered. Several video streams of views inside and outside the experimental hutch are available for real-time monitoring. The bottom status bar is displayed on all tabs and includes system messages, the accelerator current, control status, shutter status and a digital clock.
Figure 4
Figure 4
The Collect tab in the Blu-Ice interface. Multiple monochromatic or MAD data-collection runs are set up and executed in this tab. The image file names that will be generated based on the input parameters are displayed in a list located in the center of the window. Dose control provides a constant X-ray flux on the sample compensating for the SPEAR current decay. Data collection can be interrupted by clicking on the ‘pause’ button and the diffraction images are displayed as they are collected.
Figure 5
Figure 5
The Blu-Ice Scan tab. Users select an absorption edge to scan using the periodic table graphic. A complete absorption scan is recorded and analyzed automatically, identifying optimized energies for a multi-wavelength anomalous dispersion (MAD) experiment.
Figure 6
Figure 6
View of NX Client running on a Windows operating system. The user is presented with a beamline Linux desktop within a standard window. Blu-Ice and other applications (such as MOSFLM) are executed remotely through this interface exactly as if the user was at the beamline. NX Client also runs on the Mac and Linux operating systems.
Figure 7
Figure 7
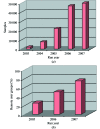
(a) Total number of samples screened each year with the Stanford Auto-Mounter (SAM) system since its release to general users in 2003. To date, over 200 000 samples have been screened by more than 80 research groups. (b) The percentage of user groups that collect data remotely each year since remote access was first offered to general users in 2005. To date, more than 75% of the SSRL user community collects data remotely.

Similar articles

Cited by

References

    1. Arvai, A. (2008). The Scripps Research Institute.
    1. Bushnell, D. A., Cramer, P. & Kornberg, R. D. (2002). Proc. Natl Acad. Sci. USA, 99, 1218–1222. - PMC - PubMed
    1. Bushnell, D. A. & Kornberg, R. D. (2003). Proc. Natl Acad. Sci. USA, 100, 6969–6973. - PMC - PubMed
    1. Bushnell, D. A., Westover, K. D., Davis, R. E. & Kornberg, R. D. (2004). Science, 303, 983–988. - PubMed
    1. Cipriani, F. et al. (2006). Acta Cryst. D62, 1251–1259. - PubMed

Publication types

Substances