. 2009 Jul;127(3):312-25.
doi: 10.1111/j.1365-2567.2008.02985.x. Epub 2008 Nov 14.

Induction of lymphotoxin-alpha by interleukin-12 p40 homodimer, the so-called biologically inactive molecule, but not IL-12 p70

Affiliations

Induction of lymphotoxin-alpha by interleukin-12 p40 homodimer, the so-called biologically inactive molecule, but not IL-12 p70

Malabendu Jana et al. Immunology. 2009 Jul.

Abstract

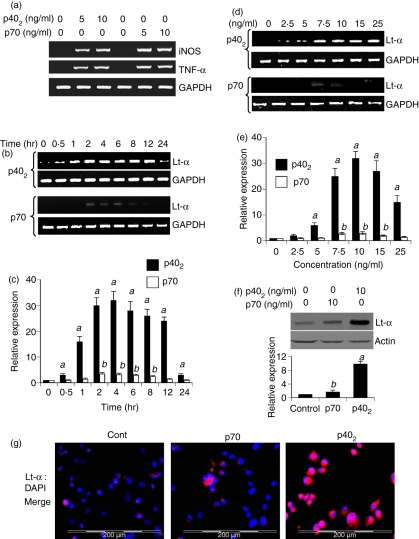
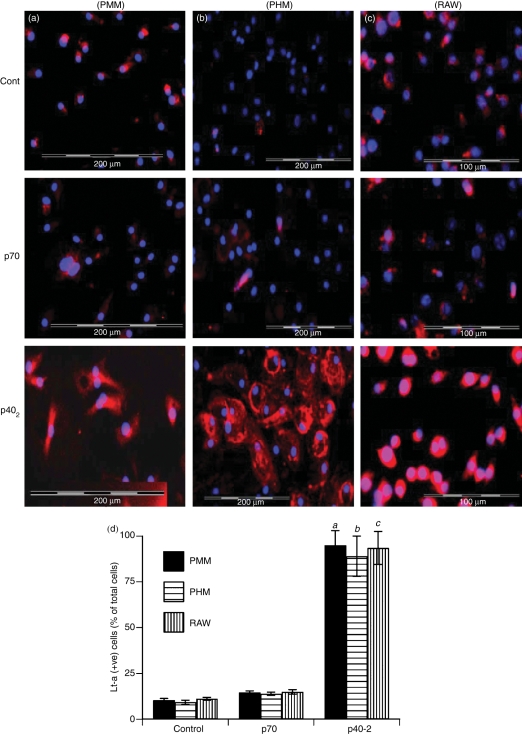
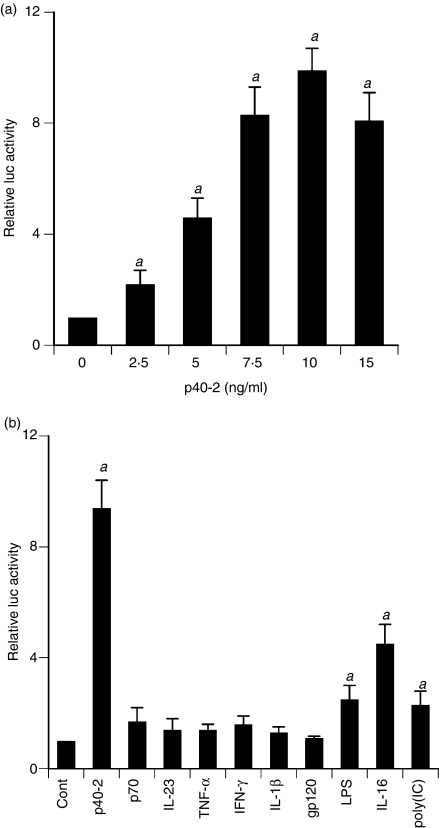
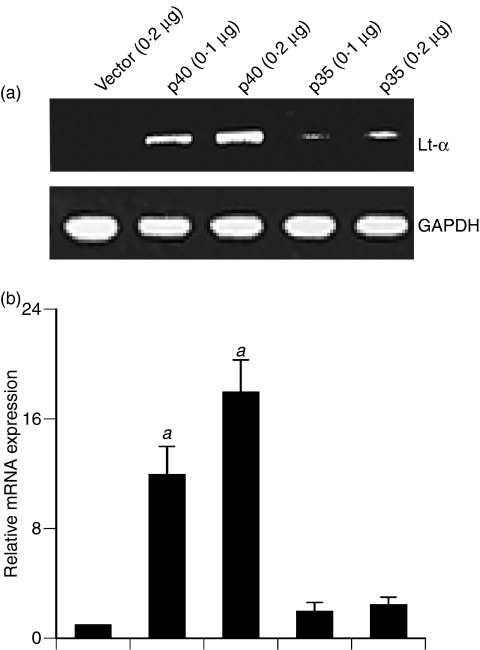
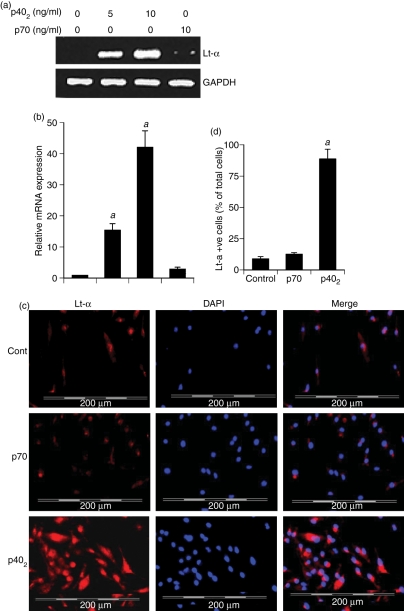
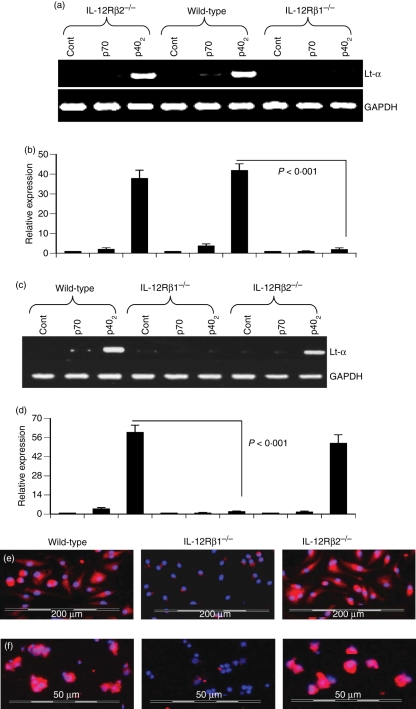
Interleukin-12 (IL-12) p70 (p40:p35) is a bioactive cytokine and its biological functions are becoming clear. On the other hand, the IL-12 p40 homodimer (p40(2)) was considered an inactive or inhibitory molecule and its functions are poorly understood. It has been reported that increased expression of lymphotoxin-alpha (Lt-alpha) in the central nervous system as well as in peripheral immune cells is associated with multiple sclerosis and experimental allergic encephalomyelitis. Here we describe that p40(2) induces the expression of Lt-alpha in primary mouse and human microglia, BV-2 microglial cells, splenic macrophages, RAW 264.7 cells and splenic T cells. Interestingly, IL-12 p70 was either unable to induce Lt-alpha or was a very weak inducer of Lt-alpha in these cell types. Consistently, p40(2), but not p70, induced Lt-alpha promoter-driven luciferase activity in microglial cells. Among various stimuli tested, p40(2) emerged as the most potent followed by IL-16, lipopolyaccharide and double-stranded RNA in inducing the activation of Lt-alpha promoter in microglial cells. Furthermore, an increase in Lt-alpha messenger RNA expression by overexpression of p40, but not p35, complementary DNA and induction of Lt-alpha expression by p40(2) in microglia isolated from IL-12p35(-/-) mice confirm that p40, but not p35, is responsible for the induction of Lt-alpha. Finally, by using primary microglia from IUL-12 receptor beta1 deficient (IL-12Rbeta1(-/-)) and IL-12Rbeta2(-/-) mice, we demonstrate that p40(2) induced the expression of Lt-alpha in microglia and macrophages via IL-12Rbeta1, but not IL-12Rbeta2. These studies delineate a novel biological function of p40(2) that is absent in IL-12.


Figures

Figure 1
Figure 1
Time- and dose-dependent induction of lymphotoxin-α (Lt-α) expression by interleukin-12 (IL-12) p40 homodimer (p402) and p70 in mouse BV-2 microglial cells. Cells were stimulated with different concentrations of p402 and p70 under serum-free conditions. After 6 hr of stimulation, total RNA was analysed for the expression of inducible nitric oxide synthase (iNOS) and tumour necrosis factor-α (TNF-α) by semi-quantitative reverse transcription–polymerase chain reaction (RT-PCR) (a). Cells were stimulated with p402 (10 ng/ml) and p70 (10 ng/ml) under serum-free conditions. At different time-points of stimulation, total RNA was analysed for the expression of Lt-α by semi-quantitative RT-PCR (b) and quantitative real-time PCR (c). Cells were stimulated with different concentrations of p402 and p70 under serum-free conditions. After 6 hr of stimulation, the messenger RNA expression of Lt-α was monitored by semi-quantitative RT-PCR (d) and quantitative real-time PCR (e). Results are means ± SD of three different experiments. aP< 0·001 versus control for p402; bP< 0·001 versus control for p70. (f) After 18 hr of stimulation, the expression of Lt-α protein was monitored by Western blot analysis. Actin was used as loading control. The relative expression of Lt-α (Lt-α/Actin) was measured after scanning the bands (lower panel). Results represent mean ± SD of three separate experiments. aP< 0·001 and bP< 0·05 versus control. (g) After 18 hr of stimulation, the level of Lt-α protein was monitored by immunofluorescence. DAPI was used to visualize nucleus. Results represent three independent experiments.
Figure 3
Figure 3
Effect of p402 and p70 on the expression of lymphotoxin-α (Lt-α) protein in different cell types. Microglia (PMM) isolated from 7- to 9-day-old mouse pups (a), microglia (PHM) isolated from 13- to 17-week-old human fetal brains (b) and RAW 264.7 cells (c) were stimulated with 10 ng/ml p402 and p70 separately under the serum-free condition. After 18 hr of stimulation, the expression of Lt-α protein was monitored by immunofluorescence. DAPI was used to visualize the nucleus. Figures show merged images of DAPI and Lt-α. (d) Lt-α-positive cells were counted in three different slides of each of three different experiments in an Olympus IX81 fluorescence microscope using the microsuite imaging software and are expressed as % total DAPI-positive cells. aP < 0·001 versus control for PMM; bP< 0·001 versus control for PHM; cP < 0·001 versus control for RAW cells.
Figure 2
Figure 2
Effect of p402 and p70 on the expression of lymphotoxin-α (Lt-α) messenger RNA in different cell types. Microglia isolated from 7- to 9-day-old mouse pups (a), microglia isolated from 13- to 17-week-old human fetal brains (b), mouse peritoneal macrophages (c), RAW 264.7 cells (d), and splenic T cells (e) were stimulated with different concentrations of p402 and p70 under serum-free condition. After 6 hr of stimulation, the messenger RNA expression of Lt-α was monitored by semi-quantitative reverse transcription–polymerase chain reaction. Results represent three independent experiments.
Figure 4
Figure 4
Effect of different proinflammatory molecules on lymphotoxin-α (Lt-α) promoter-driven luciferase activity in mouse BV-2 microglial cells. Cells plated at 50–60% confluence in 12-well plates were transfected with 0·25 μg pLt-α-Luc and 25 ng pRL-TK (Renilla luciferase control) by Lipofectamine Plus (Invitrogen) as described is Materials and methods. Twenty-four hours after transfection, cells were stimulated with different concentrations of p402 (a) or with different stimuli (b) for 6 hr under serum-free conditions. Firefly and Renilla luciferase activities were determined using a Dual Luciferase Kit (Promega) following the manufacturer’s protocol. Data are mean ± SD of three separate experiments. aP< 0·001 versus control. Concentrations of different stimuli are as follows: p402, 10 ng/ml; lipopolysaccharide (LPS), 1 μg/ml; p70, 10 ng/ml; interleukin-23 (IL-23), 10 ng/ml; tumour necrosis factor-α (TNF-α), 20 ng/ml; interferon-γ (IFN-γ), 12·5 mU/ml; gp120, 200 pg/ml; IL-16, 10 ng/ml; poly(IC), 100 μg/ml; IL-1β, 10 ng/ml.
Figure 5
Figure 5
Expression of p40, but not p35, complementary DNA (cDNA) induces the expression of lymphotoxin-α (Lt-α) in BV2 microglial cells: Microglial cells plated in 12-well plates were transfected with different amounts of either p40 or p35 cDNA by LipofectAMINE Plus (Invitrogen). Empty vector (pCIneo mammalian expression vector from Promega) was used as control. After 24 hr of transfection, cells were incubated in serum-free media. After 6 hr, the messenger RNA expression of Lt-α was monitored by semi-quantitative reverse transcription–polymerase chain reaction (PCR) (a) and quantitative real-time PCR (b). Results are means ± SD of three different experiments. aP< 0·001 versus control.
Figure 6
Figure 6
Effect of p402 and p70 on the expression of lymphotoxin-α (Lt-α) in p35−/− microglia. Microglia isolated from wild-type and p35−/− mice were stimulated with different concentrations of p402 under serum-free conditions. After 6 hr of stimulation, the messenger RNA expression of Lt-α was monitored by reverse transcription–polymerase chain reaction (PCR) (a) and real-time PCR (b). Results are means ± SD of three different experiments. aP< 0·001 versus control. After 18 hr of stimulation, cells were immunostained with antibodies against Lt-α. DAPI was used to visualize nucleus (c). Lt-α-positive cells were counted in three different slides of each of three different experiments in an Olympus IX81 fluorescence microscope using the microsuite imaging software and are expressed as % total DAPI-positive cells (d). aP< 0·001 versus control.
Figure 7
Figure 7
Effect of p402 and p70 on the expression of lymphotoxin-α (Lt-α) in primary microglia and peritoneal macrophages isolated from wild-type, interleukin-12 receptor β1 deficient (IL-12Rβ1−/−) and IL-12Rβ2−/− mice: Microglia (a and b) and macrophages (c and d) isolated from B6.129 wild-type, IL-12Rβ1−/− and IL-12Rβ2−/− mice were stimulated with 10 ng/ml of p402 and p70 under serum-free conditions. After 6 hr of stimulation, the messenger RNA expression of Lt-α was monitored by semi-quantitative reverse transcription–polymerase chain reaction (RT-PCR) (a and c) and quantitative real-time PCR (b and d). Results are means ± SD of three different experiments. Microglia (e) and macrophages (f) isolated from B6.129 wild-type, IL-12 Rβ1−/− and IL-12Rβ2−/− mice were stimulated with 10 ng/ml of p402 and p70 under serum-free conditions. After 18 hr of stimulation, cells were immunostained with antibodies against Lt-α. DAPI was used to visualize the nucleus. Figures show merged images of DAPI and Lt-α. Results represent three independent experiments.

Similar articles

Cited by

References

    1. Crowe PD, VanArsdale TL, Walter BN, et al. A lymphotoxin-beta-specific receptor. Science. 1994;264:707–10. - PubMed
    1. Cannella B, Sizing ID, Benjamin CD, Browning JL, Raine CS. Antibodies to lymphotoxin alpha (LT alpha) and LT beta recognize different glial cell types in the central nervous system. J Neuroimmunol. 1997;78:172–9. - PubMed
    1. Matusevicius D, Navikas V, Soderstrom M, Xiao BG, Haglund M, Fredrikson S, Link H. Multiple sclerosis: the proinflammatory cytokines lymphotoxin-alpha and tumour necrosis factor-alpha are upregulated in cerebrospinal fluid mononuclear cells. J Neuroimmunol. 1996;66:115–23. - PubMed
    1. Suen WE, Bergman CM, Hjelmstrom P, Ruddle NH. A critical role for lymphotoxin in experimental allergic encephalomyelitis. J Exp Med. 1997;186:1233–40. - PMC - PubMed
    1. Navikas V, He B, Link J, et al. Augmented expression of tumour necrosis factor-alpha and lymphotoxin in mononuclear cells in multiple sclerosis and optic neuritis. Brain. 1996;119(Pt 1):213–23. - PubMed

Publication types

MeSH terms