. 2009 Feb;83(3):1228-39.
doi: 10.1128/JVI.01545-08. Epub 2008 Nov 19.

HLA-associated clinical progression correlates with epitope reversion rates in early human immunodeficiency virus infection

Collaborators, Affiliations

HLA-associated clinical progression correlates with epitope reversion rates in early human immunodeficiency virus infection

A Duda et al. J Virol. 2009 Feb.

Abstract

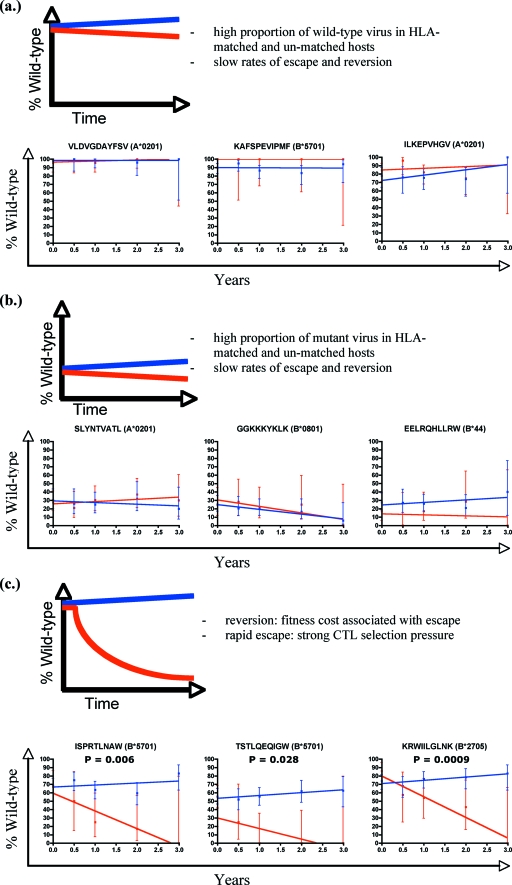
Human immunodeficiency virus type 1 (HIV-1) can evade immunity shortly after transmission to a new host but the clinical significance of this early viral adaptation in HIV infection is not clear. We present an analysis of sequence variation from a longitudinal cohort study of HIV adaptation in 189 acute seroconverters followed for up to 3 years. We measured the rates of variation within well-defined epitopes to determine associations with the HLA-linked hazard of disease progression. We found early reversion across both the gag and pol genes, with a 10-fold faster rate of escape in gag (2.2 versus 0.27 forward mutations/1,000 amino acid sites). For most epitopes (23/34), variation in the HLA-matched and HLA-unmatched controls was similar. For a minority of epitopes (8/34, and generally associated with HLA class I alleles that confer clinical benefit), new variants appeared early and consistently over the first 3 years of infection. Reversion occurred early at a rate which was HLA-dependent and correlated with the HLA class 1-associated relative hazard of disease progression and death (P = 0.0008), reinforcing the association between strong cytotoxic T-lymphocyte responses, viral fitness, and disease status. These data provide a comprehensive overview of viral adaptation in the first 3 years of infection. Our findings of HLA-dependent reversion suggest that costs are borne by some escape variants which may benefit the host, a finding contrary to a simple immune evasion paradigm. These epitopes, which are both strongly and frequently recognized, and for which escape involves a high cost to the virus, have the potential to optimize vaccine design.


Figures

FIG. 1.
FIG. 1.
Prevalence of mutations in the HIV gag and pol genes in the first 3 years of infection. The prevalence of nonsynonymous mutations was measured at baseline, 6 months, 1 year, 2 years, and 3 years following seroconversion in the gag and pol genes. The prevalence of FMs (a) and BMs (b) were determined by coding when mutations at every amino acid either arose or reverted in each patient and normalizing these values per 1,000 amino acids (aa). Each data point is shown with 95% confidence intervals.
FIG. 2.
FIG. 2.
Prevalence of variation within defined optimal epitopes in HLA-matched and HLA-unmatched patients. For the epitopes shown, the percentage of those with wild-type sequences is shown for each time point. Each epitope is analyzed according to whether patients carried the restricting HLA class I allele (blue for HLA-unmatched and red for HLA-matched epitopes). Best-fit lines are drawn through the points using linear regression. Error bars show the 95% confidence intervals for each time point. Epitopes are divided into three groups and shown with an illustrative model: those that are conserved at baseline and over time regardless of HLA matching (a), those that are variant at baseline and over time (b), and those that are conserved at baseline but become more variable over time in the HLA-matched patients only (c). P values represent whether there is a statistically significant difference in the slopes of the two datasets.
FIG. 3.
FIG. 3.
Rates of mutation in the first 3 years of infection in HLA-matched and HLA-unmatched epitopes. Each epitope is plotted according to its rate of change (percent change in wild type/year) in HLA-matched and -unmatched patients. The insert shows the implications of a data point lying in each of the four quadrants. Each epitope can be identified using the key. HLA-ve, HLA negative; HLA+ve, HLA positive; WT, wild type; MT, mutation/mutant.
FIG. 4.
FIG. 4.
The evolution of epitopes over time. The figure shows the transit of neutral (a) and dynamic (b) epitopes across the plot over time. Each epitope is plotted at each time point according to the relative prevalence of wild-type (WT) sequences in HLA-matched (y axis) and unmatched (x axis) patients. The epitopes shown in panel a are KYKLKHIVW, restricted by A*2402 (A24); SLYNTVATL, A*0201 (A2); ALVEICTEMEK A*0301 (A3); and GPKVKQWPL, B*0801 (B8). The epitopes shown in panel b are TAFTIPSI, restricted by B*5101 (B51); ISPRTLNAW, B*5701 (B57); KRWIILGLNK, B*2705 (B27); QASKEVKNW, B*5701 (B57); and TSTLQEQIGW, B*5701 (B57).
FIG. 5.
FIG. 5.
Linear regression analysis of relative hazard of disease progression against rates of mutation within epitopes in HLA-unmatched subjects. Linear regression analysis of the rate of change of individual epitopes in HLA-unmatched patients (percent wild type/year) against the relative hazard of disease progression for the restricting HLA class I allele for time to a CD4 cell count of <200 cells/μl (a), time to AIDS 1987 (b), time to AIDS 1993 (c), and time to death (d). A negative mutation rate indicates mutation away from wild type and a positive mutation rate indicates change toward wild type (reversion).

References

    1. Addo, M. M., X. G. Yu, A. Rathod, D. Cohen, R. L. Eldridge, D. Strick, M. N. Johnston, C. Corcoran, A. G. Wurcel, C. A. Fitzpatrick, M. E. Feeney, W. R. Rodriguez, N. Basgoz, R. Draenert, D. R. Stone, C. Brander, P. J. Goulder, E. S. Rosenberg, M. Altfeld, and B. D. Walker. 2003. Comprehensive epitope analysis of human immunodeficiency virus type 1 (HIV-1)-specific T-cell responses directed against the entire expressed HIV-1 genome demonstrate broadly directed responses, but no correlation to viral load. J. Virol. 772081-2092. - PMC - PubMed
    1. Almeida, J. R., D. A. Price, L. Papagno, Z. A. Arkoub, D. Sauce, E. Bornstein, T. E. Asher, A. Samri, A. Schnuriger, I. Theodorou, D. Costagliola, C. Rouzioux, H. Agut, A. G. Marcelin, D. Douek, B. Autran, and V. Appay. 2007. Superior control of HIV-1 replication by CD8+ T cells is reflected by their avidity, polyfunctionality, and clonal turnover. J. Exp. Med. 2042473-2485. - PMC - PubMed
    1. Altfeld, M., E. T. Kalife, Y. Qi, H. Streeck, M. Lichterfeld, M. N. Johnston, N. Burgett, M. E. Swartz, A. Yang, G. Alter, X. G. Yu, A. Meier, J. K. Rockstroh, T. M. Allen, H. Jessen, E. S. Rosenberg, M. Carrington, and B. D. Walker. 2006. HLA alleles associated with delayed progression to AIDS contribute strongly to the initial CD8+ T cell response against HIV-1. PLoS Med. 3e403. - PMC - PubMed
    1. Asquith, B., C. T. Edwards, M. Lipsitch, and A. R. McLean. 2006. Inefficient cytotoxic T lymphocyte-mediated killing of HIV-1-infected cells in vivo. PLoS Biol. 4e90. - PMC - PubMed
    1. Asquith, B., and A. R. McLean. 2007. In vivo CD8+ T cell control of immunodeficiency virus infection in humans and macaques. Proc. Natl. Acad. Sci. USA 1046365-6370. - PMC - PubMed

Publication types