. 2009 Feb;101(2):655-64.
doi: 10.1152/jn.90545.2008. Epub 2008 Nov 19.

Relevance of error: what drives motor adaptation?

Affiliations

Relevance of error: what drives motor adaptation?

Kunlin Wei et al. J Neurophysiol. 2009 Feb.

Abstract

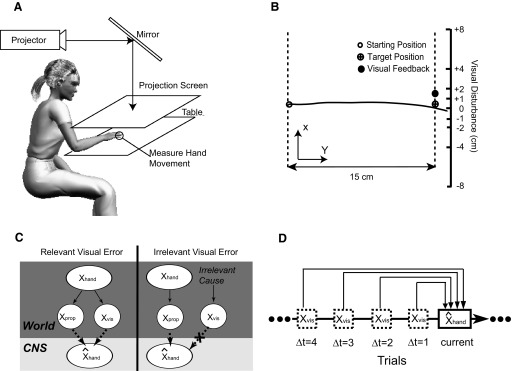
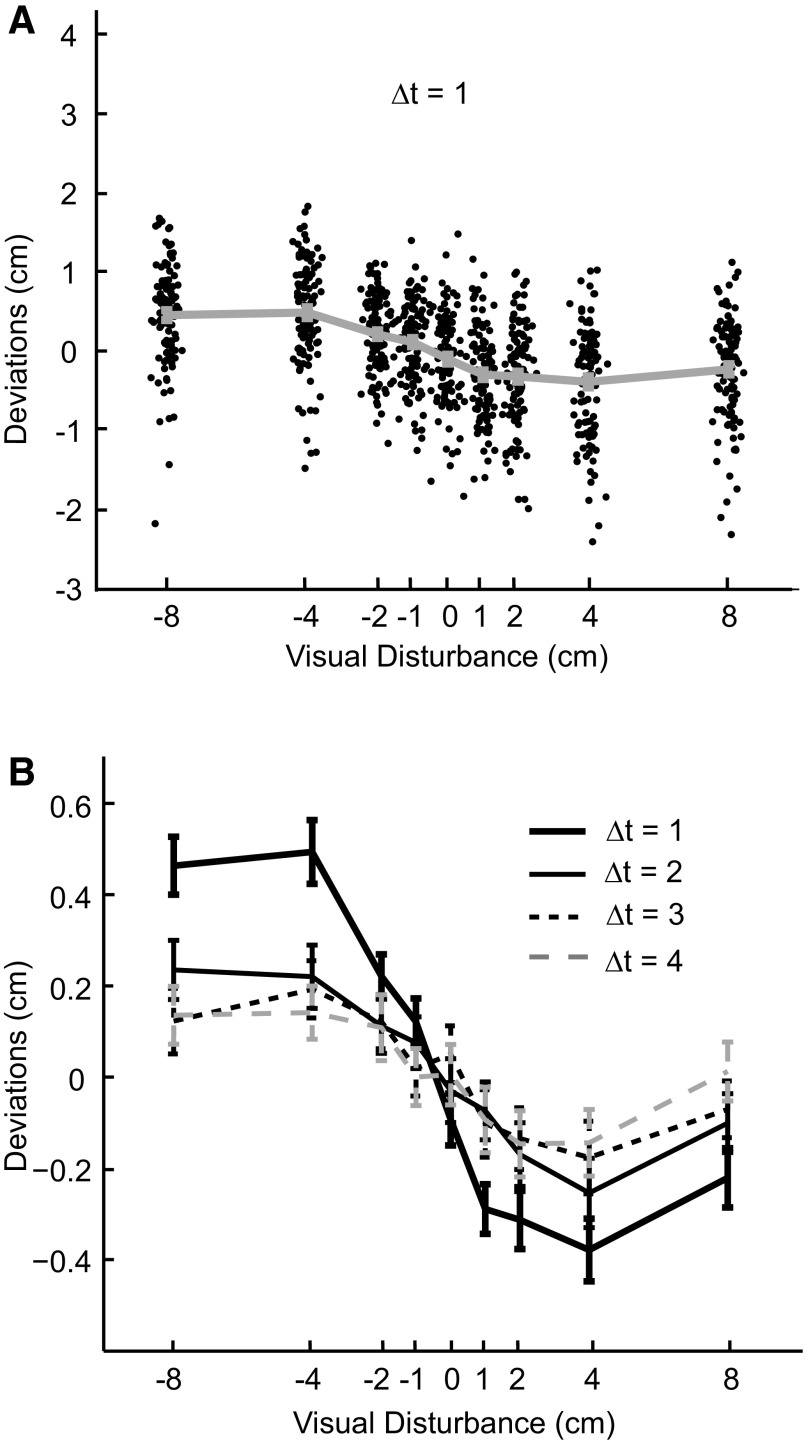
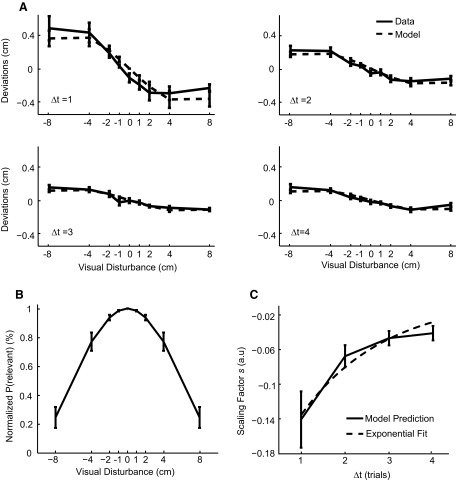
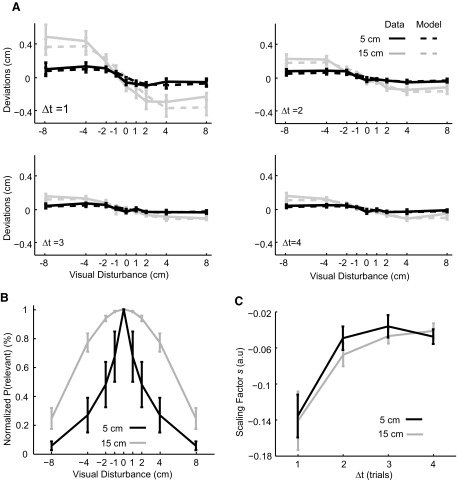
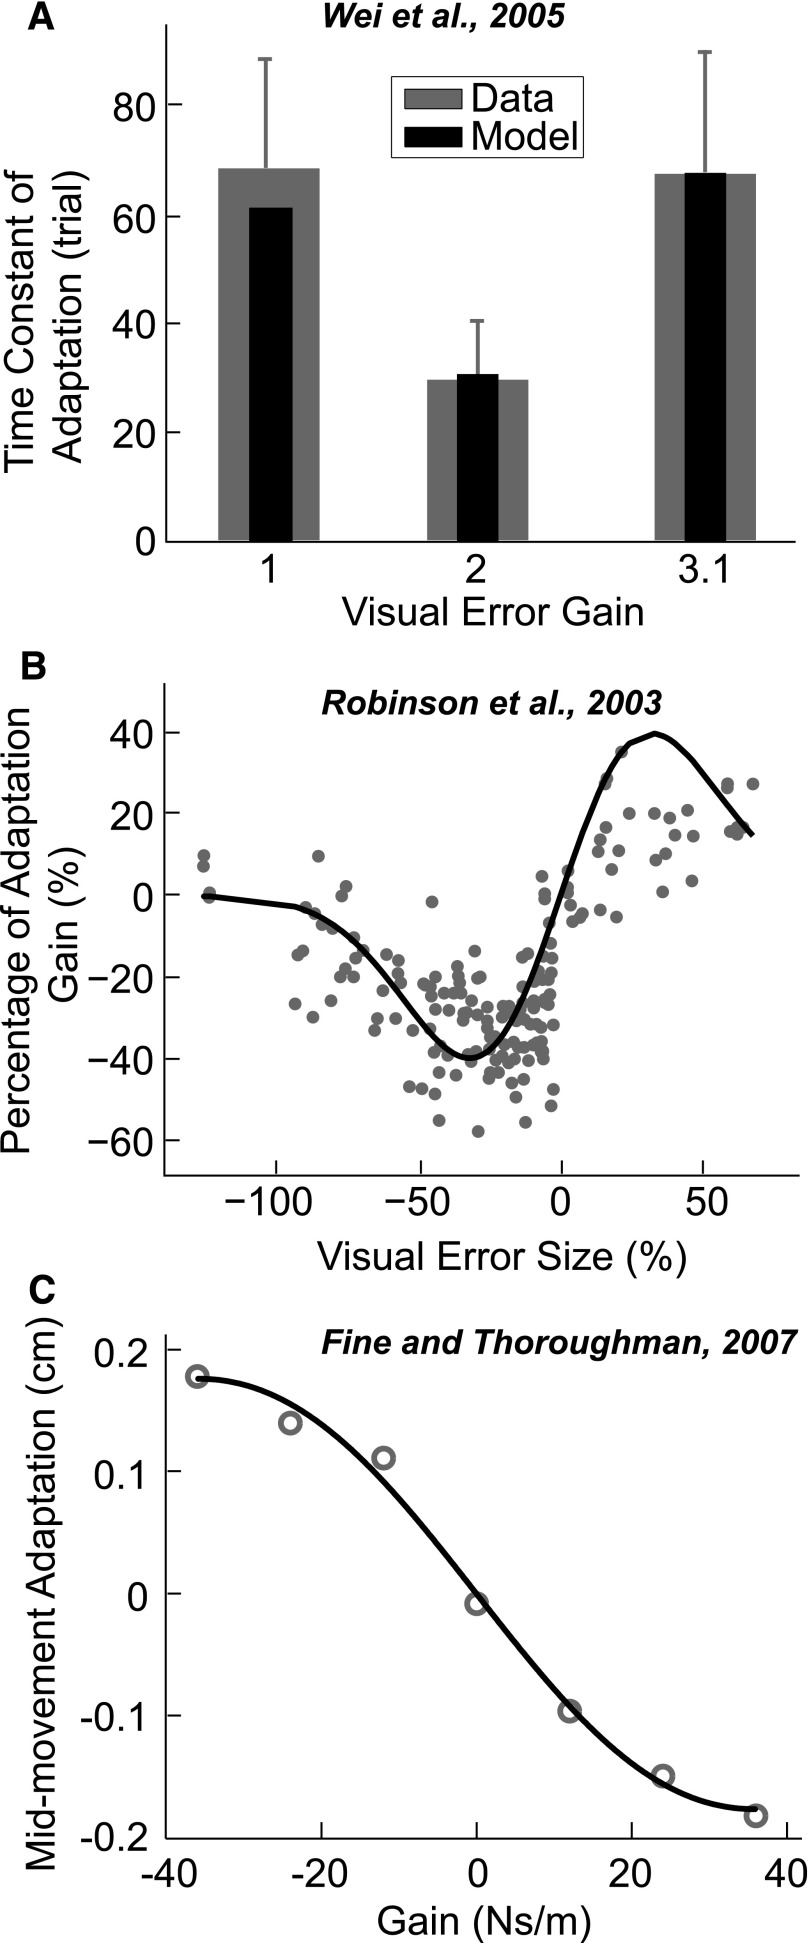
During motor adaptation the nervous system constantly uses error information to improve future movements. Today's mainstream models simply assume that the nervous system adapts linearly and proportionally to errors. However, not all movement errors are relevant to our own action. The environment may transiently disturb the movement production-for example, a gust of wind blows the tennis ball away from its intended trajectory. Apparently the nervous system should not adapt its motor plan in the subsequent tennis strokes based on this irrelevant movement error. We hypothesize that the nervous system estimates the relevance of each observed error and adapts strongly only to relevant errors. Here we present a Bayesian treatment of this problem. The model calculates how likely an error is relevant to the motor plant and derives an ideal adaptation strategy that leads to the most precise movements. This model predicts that adaptation should be a nonlinear function of the size of an error. In reaching experiments we found strong evidence for the predicted nonlinear strategy. The model also explains published data on saccadic gain adaptation, adaptation to visuomotor rotations, and force perturbations. Our study suggests that the nervous system constantly and effortlessly estimates the relevance of observed movement errors for successful motor adaptation.


Figures

FIG. 1.
FIG. 1.
Experimental setup and an exemplary movement trajectory. A: sketch of the experimental setup. The hand movement is measured by the robot and displayed as a cursor. The projector displays the cursor and the starting and target positions. Vision of the arm is occluded. B: typical movement trajectories (shown as a solid black line) are shown in a projection from above along with the visual error feedback received by the subject (black dot). C: graphical model of relevance estimation. When the error is inferred as relevant both proprioceptive and visual cues are used to estimate the hand position. When visual cues are inferred to be irrelevant to movement production, it will be disregarded and only proprioceptive cues are used. The final estimate of the hand position is a weighted average of position estimates from both cases where the weights are the probability of each case given the 2 types of sensory cues. D: illustration of time-varying effect of visual feedback in previous trials. The current estimation of hand position is influenced by visual feedbacks from 4 previous trials that are marked as Δt = 1, 2, 3, and 4, respectively.
FIG. 2.
FIG. 2.
The data from a typical subject. A: deviations from all trials plotted as a function of the previous visual disturbances (Δt = 1). Each dot stands for a single reach and the gray error bar shows the mean and SE (Note: it is small) for each visual disturbance type. Data points are spread in the x direction for better visibility. B: mean deviations are plotted as a function of the size of visual disturbances for the same typical subject. Each line stands for data from trials of different lags.
FIG. 3.
FIG. 3.
Data and model predictions for the first experiment with 15-cm movement amplitude from all subjects. Error bars denote the SEs over subjects. A: mean deviations and the corresponding model predictions are plotted as a function of the size of visual disturbances for all subjects. Different subplots are for trials from different trial lags Δt. B: the normalized probability of relevant error as a function of the size of visual disturbances. C: the estimated scaling factor is plotted as a function of trial lags. An exponential function is fitted and shown as a dashed line.
FIG. 4.
FIG. 4.
Data and model predictions for the second experiment with 5-cm movement amplitudes from all subjects. Error bars denote the SEs over subjects. Data and model predictions from the first experiment are plotted in gray lines for direct comparison. A: mean deviations from the data and corresponding model predictions are plotted as a function of the size of visual disturbances for all subjects. Different subplots are for trials from different trial lags Δt. B: the normalized probability of relevant error is plotted as a function of the size of visual disturbances. C: the estimated scaling factor is plotted as a function of trial lags.
FIG. 5.
FIG. 5.
Empirical data from three other adaptation studies and the corresponding predictions of the relevance estimation model. A: the study by Wei et al. (2005): the adaptation rate in a visuomotor adaptation task is plotted as a function of visual error gain (gray bars). The black bars denote predictions from the relevance estimation model. B: the study by Robinson et al. (2003): the adaptation gain in saccades is plotted as a function of the visual error size. The line is the prediction from the relevance estimation model. C: the study by Fine and Thoroughman (2007): the amount of adaptation in reaching movements is plotted as a function of the gain of the viscous perturbation. The gray circles are the data from the paper and the black line is the prediction from the relevance estimation model.

References

    1. Baddeley RJ, Ingram HA, Miall RC. System identification applied to a visuomotor task: near-optimal human performance in a noisy changing task. J Neurosci 23: 3066–3075, 2003. - PMC - PubMed
    1. Bock O Load compensation in human goal-directed arm movement. Behav Brain Res 41: 167–177, 1990. - PubMed
    1. Bock O Adaptation of aimed arm movements to sensorimotor discordance: evidence for direction-independent gain control. Behav Brain Res 51: 41–50, 1992. - PubMed
    1. Burgar CG, Lum PS, Shor PC, Machiel Van der Loos HF. Development of robots for rehabilitation therapy: the Palo Alto VA/Stanford experience. J Rehabil Res Dev 37: 663–673, 2000. - PubMed
    1. Burnham KP, Anderson DR. Model Selection and Multimodel Inference: A Practical-Theoretic Approach. New York: Springer, 2002.

Publication types

LinkOut - more resources