. 2008 Nov 19;28(47):12318-27.
doi: 10.1523/JNEUROSCI.3918-08.2008.

Crucial role of alpha4 and alpha6 nicotinic acetylcholine receptor subunits from ventral tegmental area in systemic nicotine self-administration

Affiliations

Crucial role of alpha4 and alpha6 nicotinic acetylcholine receptor subunits from ventral tegmental area in systemic nicotine self-administration

S Pons et al. J Neurosci. .

Abstract

The identification of the molecular mechanisms involved in nicotine addiction and its cognitive consequences is a worldwide priority for public health. Novel in vivo paradigms were developed to match this aim. Although the beta2 subunit of the neuronal nicotinic acetylcholine receptor (nAChR) has been shown to play a crucial role in mediating the reinforcement properties of nicotine, little is known about the contribution of the different alpha subunit partners of beta2 (i.e., alpha4 and alpha6), the homo-pentameric alpha7, and the brain areas other than the ventral tegmental area (VTA) involved in nicotine reinforcement. In this study, nicotine (8.7-52.6 microg free base/kg/inf) self-administration was investigated with drug-naive mice deleted (KO) for the beta2, alpha4, alpha6 and alpha7 subunit genes, their wild-type (WT) controls, and KO mice in which the corresponding nAChR subunit was selectively re-expressed using a lentiviral vector (VEC mice). We show that WT mice, beta2-VEC mice with the beta2 subunit re-expressed exclusively in the VTA, alpha4-VEC mice with selective alpha4 re-expression in the VTA, alpha6-VEC mice with selective alpha6 re-expression in the VTA, and alpha7-KO mice promptly self-administer nicotine intravenously, whereas beta2-KO, beta2-VEC in the substantia nigra, alpha4-KO and alpha6-KO mice do not respond to nicotine. We thus define the necessary and sufficient role of alpha4beta2- and alpha6beta2-subunit containing nicotinic receptors (alpha4beta2*- and alpha6beta2*-nAChRs), but not alpha7*-nAChRs, present in cell bodies of the VTA, and their axons, for systemic nicotine reinforcement in drug-naive mice.


Figures

Figure 1.
Figure 1.
A, Set-up and simplified scheme for intravenous self-administration experiments. Each nose-poke of the Active (A) mouse activates a computer-operated syringe pump which delivers a nicotine injection into the tail vein of both the A and the yoked Passive (P) mouse. B, Concentration-dependent nicotine intravenous SA in C57BL/6J drug-naive mice. Each bar (y-axis at left) represents the mean ± SEM of the cumulative nose pokes (NPs) of the active mice (A, black bars) and passive yoked controls (P, white bars) over the 30 min session. Each gray bar (y-axis at right) represents the R value for mice self-administering saline (Sal) or different nicotine concentrations over the 30 min session. Drug doses are expressed as μg/kg/infusion. **p < 0.01 vs yoked passive and saline groups. ANOVA followed by Dunnett's test (n = 12–18 pairs of animals). ***p < 0.001 vs saline control group. ANOVA followed by Dunnett's test (n = 12–18 pairs of animals).
Figure 2.
Figure 2.
A, Nicotine intravenous SA in β2-nAChR knock-out (KO) and wild-type (WT) mice. Each bar (y-axis at left) represents the mean ± SEM of the cumulative nose pokes (NPs) of the β2-WT (left) and β2-KO (right) active mice (A, black bars) and passive yoked controls (P, white bars) over the 30 min session. Each gray bar (y-axis at right) represents the R value for β2-WT (left) and β2-KO (right) mice self-administering nicotine over the 30 min session. Doses are expressed as μg/kg/inf. #p < 0.05 vs corresponding saline group and **p < 0.01 vs corresponding yoked passive group. ANOVA followed by Dunnett's test (n = 7–13 pairs of animals). ***p < 0.001 vs corresponding saline group. ANOVA followed by Dunnett's test (n = 7–13 pairs of animals). B, Nicotine intravenous SA in ventral tegmental area (VTA) re-expressed β2-KO mice (β2-VEC-VTA mice). Each bar (y-axis at left) represents the mean ± SEM of the cumulative nose pokes (NPs) of the β2-VEC-VTA active mice (A, black bars) and passive yoked controls (P, white bars) over the 30 min session. Each gray bar (y-axis at right) represents the R value for β2-VEC-VTA mice self-administering saline (Sal) or nicotine over the 30 min session. Doses are expressed as μg/kg/inf. **p < 0.01 vs yoked passive mice and saline controls. ANOVA followed by Dunnett's test (n = 6–8 pairs of animals). *p < 0.05 vs saline control group. ANOVA followed by Dunnett's test (n = 6–8 pairs of animals). C, Nicotine intravenous SA in substantia nigra (SN) re-expressed β2-KO mice (β2-VEC-SN mice). Each bar (y-axis at left) represents the mean ± SEM of the cumulative nose pokes (NPs) of the β2-VEC-SN active mice (A, black bars) and passive yoked controls (P, white bars) over the 30 min session (n = 6–14 pairs of animals). Each gray bar (y-axis at right) represents the R value for β2-VEC-SN mice self-administering saline (Sal) or nicotine over the 30 min session. Doses are expressed as μg/kg/inf (n = 6–14 pairs of animals).
Figure 3.
Figure 3.
Nicotine intravenous SA in α7-nAChR KO and WT mice. Each bar (y-axis at left) represents the mean ± SEM of the cumulative nose pokes (NPs) of the α7-WT (left) and α7-KO (right) active mice (A, black bars) and passive yoked controls (P, white bars) over the 30 min session. Each gray bar (y-axis at right) represents the R value for α7-WT (left) and α7-KO (right) mice self-administering saline (Sal) or nicotine over the 30 min session. Doses are expressed as μg/kg/inf. #p < 0.05 vs corresponding saline group and **p < 0.01 vs corresponding yoked passive group. ANOVA followed by Dunnett's test (n = 6–8 pairs of animals). **p < 0.01 and ***p < 0.001 vs corresponding saline group. ANOVA followed by Dunnett's test (n = 6–8 pairs of animals).
Figure 4.
Figure 4.
A, Nicotine intravenous SA in α4-nAChR KO and WT mice. Each bar (y-axis at left) represents the mean ± SEM of the cumulative nose pokes (NPs) of the α4-WT (left) and α4-KO (right) active mice (A, black bars) and passive yoked controls (P, white bars) over the 30 min session. Each gray bar represents R value for α4-WT (left) and α4-KO (right) mice self-administering saline (Sal) nicotine over the 30 min session. Doses are expressed as μg/kg/inf. **p < 0.01 vs corresponding yoked passive and/or saline groups. ANOVA followed by Dunnett's test (n = 5–14 pairs of animals). **p < 0.01 vs corresponding saline group. ANOVA followed by Dunnett's test (n = 5–14 pairs of animals). B, Nicotine intravenous SA in VTA re-expressed α4-KO mice (α4-VEC-VTA mice). Each bar (y-axis at left) represents the mean ± SEM of the cumulative nose pokes (NPs) of the α4-VEC-VTA active mice (A, black bars) and passive yoked controls (P, white bars) over the 30 min session. Each gray bar (y-axis at right) represents the R value for α4-VEC-VTA mice self-administering saline (white bar) or nicotine (black bars) over the 30 min session. Doses are expressed as μg/kg/inf. **p < 0.01 vs corresponding saline group. ANOVA followed by Dunnett's test (n = 6–10 pairs of animals). **p < 0.01 vs saline control group. ANOVA followed by Dunnett's test (n = 6–10 pairs of animals).
Figure 5.
Figure 5.
A, Nicotine intravenous SA in α6-nAChR KO and WT mice. Each bar (y-axis at left) represents the mean ± SEM of the cumulative nose pokes (NPs) of the α6-WT (left) and α6-KO (right) active mice (A, black bars) and passive yoked controls (P, white bars) over the 30 min session. Each gray bar (y-axis at right) represents the R value for α6-WT (left) and α6-KO (right) mice self-administering saline (Sal) or nicotine over the 30 min session. Doses are expressed as μg/kg/inf. #p < 0.05 vs corresponding saline group and **p < 0.01 vs corresponding yoked passive or saline control groups. ANOVA followed by Dunnett's test (n = 6–8 pairs of animals). **p < 0.01 vs corresponding saline group. ANOVA followed by Dunnett's test (n = 6–8 pairs of animals). B, Nicotine intravenous SA in VTA re-expressed α6-KO mice (α6-VEC-VTA mice). Each bar (y-axis at left) represents the mean ± SEM of the cumulative nose pokes (NPs) of the active mice (A, black bars) and passive yoked controls (P, white bars) over the 30 min session. Each gray bar (y-axis at right) represents the R value for α6-VEC-VTA mice self-administering saline (Sal) or nicotine over the 30 min session. Doses are expressed as μg/kg/inf. ##p < 0.001 vs corresponding saline group and **p < 0.01 vs corresponding yoked passive or saline control groups. ANOVA followed by Dunnett's test (n = 9–11 pairs of animals). **p < 0.01 vs saline controls. ANOVA followed by Dunnett's test (n = 9–11 pairs of animals).
Figure 6.
Figure 6.
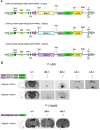
A, Lentiviral vectors used in the re-expression experiments Maps of lentiviral expression vectors. Diagrams of the three lentiviral vectors used in this study, between and including the LTR regions. LTR, long terminal repeat; RNA pack, genomic RNA packaging signal; RRE, rev response element; cPPT, central polypurine tract; CTS, central termination sequence; PGK, promoter of the mouse phosphoglycerate kinase gene; IRES2, internal ribosome entry sequence; eGFP, enhanced green fluorescent protein; WPRE, woodchuck hepatitis B virus post-transcriptional regulatory element; 3′-PPT, 3′-polypurine tract; ΔU3, deletion of the U3 portion of 3′-LTR. B, 125I-Epibatidine and 125I α-conotoxin MII autoradiography. Top: 125I-Epibatidine autoradiography, binding sites are shown in coronal sections from two different levels, VTA (Bregma −3.52 mm) and SN (Bregma −3.08 mm), in WT, β2-KO, α4-KO and vectorised mice. From left to right, wild-type (WT) signal in the VTA (arrow), in SN (arrow head), absence in the β2-KO group, restoration in β2-VEC-VTA mice, absence of epibatidine binding in the α4-KO group, restoration in α4-VEC-VTA mice. Asterisk marks α6β2* and α3β2*-nAChRs in the superior colliculus. Bottom: 125I-conotoxin MII autoradiography, from left to right: Presence of α-conotoxin MII binding sites in WT mice, absence in α6-KO mice and unilateral restoration in α6-VEC-VTA mice. The restoration of α6* binding sites in vectorised α6 KO mice is illustrated with a brain injected unilaterally, the other hemisphere being used as control. Asterisk marks α3β2*-nAChRs in the superior colliculus. Coronal drawings are modified from Paxinos and Franklin (2001).

References

    1. Alderson HL, Latimer MP, Winn P. Intravenous self-administration of nicotine is altered by lesions of the posterior, but not anterior, pedunculopontine tegmental nucleus. Eur J Neurosci. 2006;23:2169–2175. - PubMed
    1. Avale ME, Faure P, Pons S, Robledo P, Deltheil T, David DJ, Gardier AM, Maldonado R, Granon S, Changeux JP, Maskos U. Interplay of β2* nicotinic receptors and dopamine pathways in the control of spontaneous locomotion. Proc Natl Acad Sci U S A. 2008;105:15991–15996. - PMC - PubMed
    1. Balfour DJ. The neurobiology of tobacco dependence: a commentary. Respiration. 2002;69:7–11. - PubMed
    1. Benowitz NL. Compensatory smoking of low-yield cigarettes. In: Burns DM, Shopland DR, Benowitz NL, editors. Risks associated with smoking cigarettes with low machine-measured yields of tar and nicotine. Bethesda, MD: US National Institutes of Health, National Cancer Institute; 2001. pp. 39–63.
    1. Benowitz NL, Jacob P., 3rd Nicotine renal excretion rate influences nicotine intake during cigarette smoking. J Pharmacol Exp Ther. 1985;234:153–155. - PubMed

Publication types

MeSH terms

LinkOut - more resources