. 2008 Nov 19;28(47):12535-8.
doi: 10.1523/JNEUROSCI.3022-08.2008.

Impulse propagation along thalamocortical fibers can be detected magnetically outside the human brain

Affiliations

Impulse propagation along thalamocortical fibers can be detected magnetically outside the human brain

Tomoaki Kimura et al. J Neurosci. .

Abstract

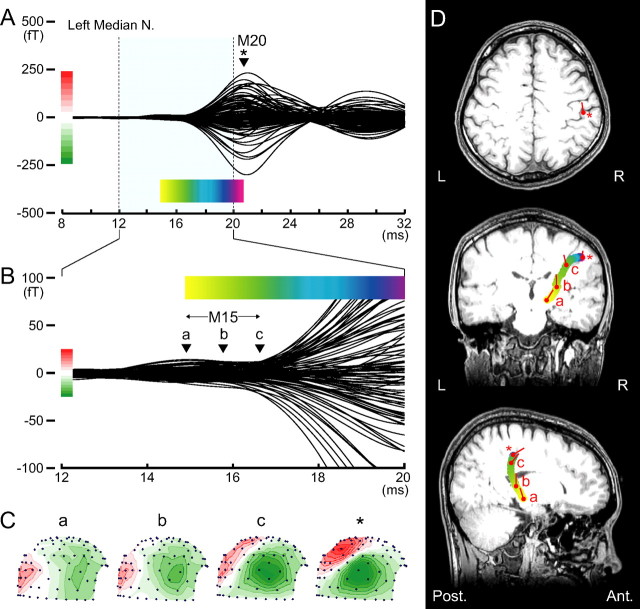
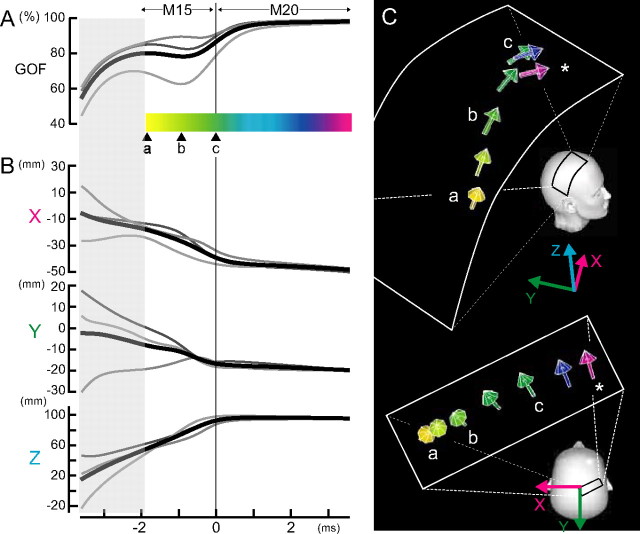
Orchestrating cortical network activity with synchronous oscillations of neurons across distant regions of the brain underlies information processing in humans (Knight, 2007) and monkeys (Saalmann et al., 2007; Womelsdorf et al., 2007). Frequencies of oscillatory activities depend, to a considerable extent, on the length and conduction velocity of the tracts connecting the neural areas that participate in oscillations (Buzsáki, 2006). However, the impulse propagation along the fiber tracts in the white matter has never been visualized in humans. Here, we show, by recording magnetoencephalogram (MEG) following median nerve stimulation, that a magnetic field component, we labeled "M15," changes dynamically within 1.6-1.8 ms before the onset of magnetic M20 response generated from the primary somatosensory cortex. This new M15 component corresponds to the intracellular depolarizing action current in the thalamocortical fibers propagating with the mean conduction velocity of 29 m/s. The findings challenge the traditional view that MEG is blind to the activity of deep subcortical structures. We argue that the MEG technique holds the promise of providing novel information in impulse transmissions along not only the thalamocortical pathway but also other fiber tracts connecting distant brain areas in humans.


Figures

Figure 1.
Figure 1.
Somatosensory magnetic fields following left median nerve stimulation in a 23-year-old man. A, Superimposed waveforms recorded from the right hemisphere (80 locations) show a clear M20 magnetic deflection; at 20.6 ms (*) after stimulus onset, the ECD is estimated in hand area of the postcentral gyrus on the right side (D, top). B, M15 deflection before M20 onset, lasting from 14.9 (a) to 16.7 (c) ms poststimulus, is highlighted with expanded scales for both magnetic strength and time. C, Right lateral view of isocontour field distributions of the magnetic field over the head surface at 4 time points; red contours, magnetic flux-out; green contours, flux-in with contour step of 3 fT for the latency of a–c in B and 30 fT for M20 peak (asterisk) in A. Note that the long distance between the maximum flux-out and minimum flux-in and wide intervals between any adjacent contour lines for flux-out or flux-in (a and b) suggest deep current sources. In contrast, the short distance between the maximum flux-out and minimum flux-in and narrow intervals between the adjacent contour lines (c and asterisk) indicate superficial current sources. D, Estimated ECDs superimposed onto the subject MRI (from top; horizontal, coronal and sagittal views). Changes in locations of the ECDs calculated successively at a 0.1 ms step until the M20 peak are illustrated as a colored curve, in which color gradation from yellow to purple corresponds to the time course of the colored bar in A or B. Note that S-shaped colored curve in the coronal view indicates sequential changes in ECD location from thalamus (yellow) to primary somatosensory cortex (purple), demonstrating impulse propagation along the thalamocortical fibers. Red circles and bars indicate the location and orientation of ECD for the latency of a–c in B or an asterisk in A.
Figure 2.
Figure 2.
Changes in locations and orientations of the ECDs for M15–M20 in three subjects. A, Gray lines represent the GOF values of M15 ECDs in each subject and the black line, the average across three subjects. The GOF values were above 75% for two subjects and above 60% for one subject. A horizontal colored bar with color gradation from yellow to purple corresponds to the time course of M15–M20 continuum. The onset latency of M20 is adjusted to 0 ms (c) across three subjects. B, Sequential ECD changes in the x-, y-, or z-coordinate from the mean location of M20 ECD at the peak latency; the x-axis pointed from the origin of 3D head coordinate system (the midpoint of the preauricular points) to the left preauricular point, the y-axis to the opposite direction of the nasion, and the z-axis to the vertex in a direction perpendicular to the X-Y plane. Note that the location of the averaged ECD changes from the deep site of the head to the right, superficial central region during 2 ms between a and c and then remains stable after M20 onset. C, Orientations of the averaged ECDs for M15–M20 continuum at various latencies; colored arrows with color gradation from yellow to purple corresponds to the time course of M15–M20 continuum (asterisk, M20 peak). Note that the averaged ECD for M15 shows changes in orientation during the period between a and c, whereas that for M20 (blue or purple arrow) is horizontally oriented toward midfrontal scalp.

References

    1. Buzsáki G. Rhythms of the brain. New York: Oxford UP; 2006.
    1. Curio G, Erné SN, Sandfort J, Scheer J, Stehr R, Trahms L. Exploratory mapping of evoked neuromagnetic activity from human peripheral nerve, brachial plexus and spinal cord. Electroencephalogr Clin Neurophysiol. 1991;81:450–453. - PubMed
    1. Desmedt JE, Cheron G. Central somatosensory conduction in man: neural generators and interpeak latencies of the far-field components recorded from neck and right or left scalp and earlobes. Electroencephalogr Clin Neurophysiol. 1980;50:382–403. - PubMed
    1. Fagaly RL. Superconducting quantum interference device instruments and applications. Rev Sci Instrum. 2006;77:101101-1–101101-45.
    1. Hari R, Joutsiniemi SL, Sarvas J. Spatial resolution of neuromagnetic records: theoretical calculations in a spherical model. Electroencephalogr Clin Neurophysiol. 1988;71:64–72. - PubMed

Publication types

LinkOut - more resources