. 2009 Aug;19(8):1820-34.
doi: 10.1093/cercor/bhn212. Epub 2008 Nov 19.

Dopamine D1 and D5 receptors are localized to discrete populations of interneurons in primate prefrontal cortex

Affiliations

Dopamine D1 and D5 receptors are localized to discrete populations of interneurons in primate prefrontal cortex

Jill R Glausier et al. Cereb Cortex. 2009 Aug.

Abstract

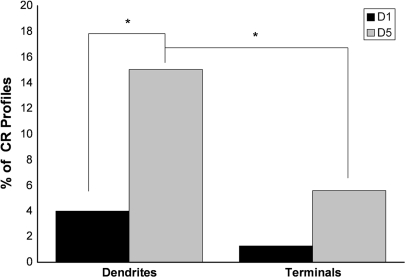
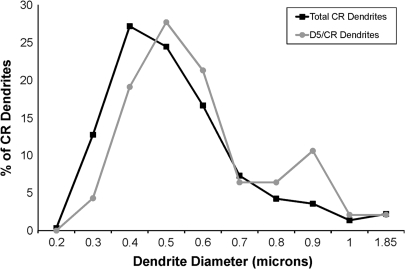
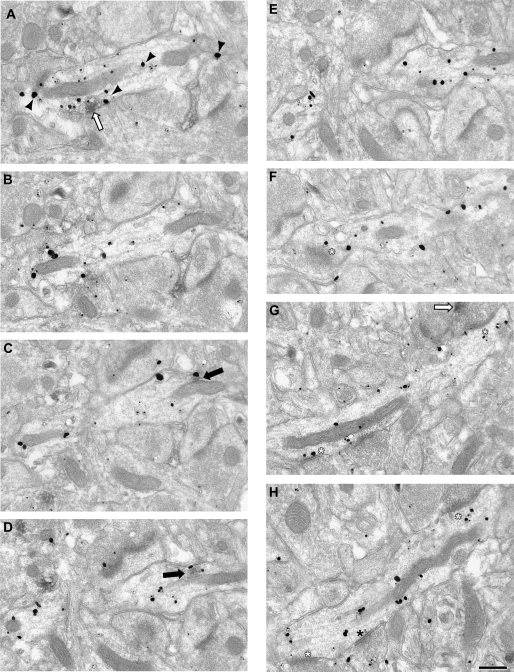
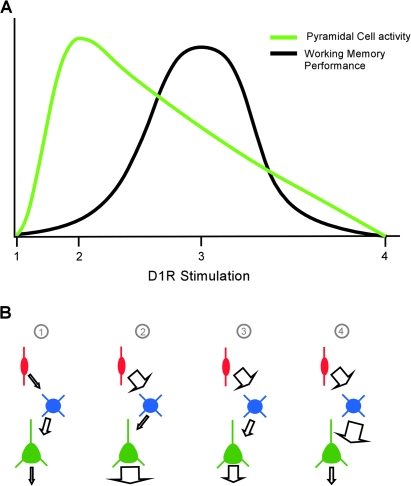
Working memory (WM) is a core cognitive process that depends upon activation of D1 family receptors (D1R) and inhibitory interneurons in the prefrontal cortex (PFC). D1R are comprised of the D(1) and D(5) subtypes, and D(5) has a 10-fold higher affinity for dopamine. Parvalbumin (PV) and calretinin (CR) are 2 interneuron populations that are differentially affected by D1R stimulation and have discrete postsynaptic targets, such that PV interneurons provide strong inhibition to pyramidal cells, whereas CR interneurons inhibit other interneurons. The distinct properties of both the D1R and interneuron subtypes may contribute to the "inverted-U" relationship of D1R stimulation and WM ability. To determine the prevalence of D(1) and D(5) in PV and CR interneurons, we performed quantitative double-label immunoelectron microscopy in layer III of macaque area 9. We found that D(1) was the predominant D1R subtype in PV interneurons and was found mainly in dendrites. In contrast, D(5) was the predominant D1R subtype in CR interneurons and was found mainly in dendrites. Integrating these findings with previously published electrophysiological data, we propose a circuitry model as a framework for understanding the inverted-U relationship between dopamine stimulation of D1R and WM performance.


Figures

Figure 1.
Figure 1.
Light microscopic images demonstrating that each antibody used in this study only produced labeling when incubated with the appropriate secondary antibody. The mouse anti-PV and mouse anti-CR antibodies only produce labeling when incubated with an anti-mouse secondary. The rat anti-D1 antibody only produced labeling when incubated with anti-rat secondary, and the rabbit anti-D5 antibody only produced labeling when incubated with anti-rabbit secondary. Scale bar is 500 μm.
Figure 2.
Figure 2.
Electron micrographs of cell bodies immunogold labeled for PV or CR (black arrowheads) which also contain DAB label (black arrows) for D1 and D5. In PV somata, the stereotypical D1 staining of the Golgi apparatus was identified (A), as well as labeling associated with other internal membrane structures, including endoplasmic reticulum and mitochondria (B). In CR somata, D5 staining was associated with internal membranes (C). Nucleus (Nuc). Scale bar is 500 nm.
Figure 3.
Figure 3.
Electron micrographs of dendrites (A–C) and an axon terminal (D) labeled for PV with immunogold (black arrowheads) and D1 with DAB. White arrows indicate DAB which contacts the plasma membrane (BD), and black arrows indicate DAB which is intracellular (A). Note the D1 DAB label is discrete and patchy. PV-labeled dendrites often received asymmetric synapses (B, C, white asterisks). PV-labeled axon terminals were typically observed to make symmetric synaptic contacts onto unlabeled dendrites (D, black asterisk). Scale bar is 500 nm.
Figure 4.
Figure 4.
A histogram showing the percentage of PV-labeled dendrites and axon terminals that also contained IR for D1 and D5. In tissue double-labeled for D1 and PV, 307 PV-IR dendrites and 179 axon terminals in total were counted. In tissue double labeled for D5 and PV, 296 dendrites and 177 axon terminals in total were counted. The frequency of D1/PV dendrites (17.3%) and axon terminals (10.6%) is greater than the frequency of D5/PV dendrites (4.7%) and axon terminals (1.7%). D1-IR was also more frequently identified in PV dendrites than axon terminals. Asterisks indicate a significant difference.
Figure 5.
Figure 5.
Graph illustrating the distribution of all PV dendritic diameters (N = 603) and the distribution of the diameters of D1/PV double-labeled dendrites (N = 53). The majority of PV dendrites had diameters between 0.4 and 0.5 μm in diameter, as did D1/PV double-labeled dendrites. These results indicate that D1 labeling is not found preferentially in small (distal) or large (proximal) caliber PV dendrites.
Figure 6.
Figure 6.
Electron micrographs illustrating the distribution of D1-IR in serial sections of a PV-labeled dendrite. PV immunogold label is present throughout the dendrite and is identified by black arrowheads in panel (A). Patches of D1-IR have been identified as intracellular (black arrows) or associated with the plasma membrane (white arrows). In panel (A), no D1-IR appears in the PV dendrite. However, in panel (B), D1-IR is present and associated with the mitochondria. The beginnings of an asymmetric synapse appear (white asterisk), and the terminal contains D1-IR. Also, a continuation of the PV-labeled dendrite is present on the left side of the image. On the right side in panel (C), D1-IR is present associated with the plasma membrane as well as internal membranes. The beginnings of another asymmetric synapse are also visible (white asterisk). On the left of panel (C), 2 asymmetric synapses are visible. In panel (D), D1-IR is present internally and associated with internal membranes as well as the plasma membrane. In panels (E and F), the D1-IR is located intracellularly, and one DAB patch is directly below an asymmetric synapse in both panels. In panels (GJ), D1-IR is associated with the plasma membrane and mitochondria, and synapses are no longer visible. Scale bar is 500 nm.
Figure 7.
Figure 7.
Electron micrographs of dendrites (A, B) labeled with immunogold (black arrowheads) for CR and DAB for D5. White arrows indicate DAB which contacts the plasma membrane (A, B), and black arrows indicate DAB which is intracellular (C, D). Note the D5 DAB label is discrete and patchy. (B) The D5/CR-labeled dendrite is receiving a symmetric synapse (black asterisk) from an unlabeled terminal. (C) CR immunogold-labeled axon terminal making a symmetric synapse (black asterisk) onto a single-labeled dendrite containing D5 DAB intracellularly. (D) CR immunogold-labeled axon terminal also containing intracellular D5 DAB label. Scale bar is 500 nm.
Figure 8.
Figure 8.
A histogram showing the percentage of CR-labeled dendrites and axon terminals that also contained IR for D1 and D5. In the D1/CR condition, 276 dendrites and 79 axon terminals in total were counted. In the D5/CR condition, 313 dendrites and 139 axon terminals in total were counted. The frequency of D5/CR dendrites (15.0%) is greater than the frequency of D1/CR dendrites (4.0%). The number of CR-IR axon terminals in the D1 double-label condition was not sufficient to permit a valid statistical analysis between D1/CR and D5/CR. The D5 receptor is more prevalent in CR dendrites (14.8%) than in CR axon terminals (5.8%). Asterisks indicate a significant difference.
Figure 9.
Figure 9.
Graph illustrating the distribution of all CR dendritic diameters (N = 589) and the distribution of the diameters of D5/CR double-labeled dendrites (N = 47). The majority of CR dendrites had diameters between 0.4 and 0.5 μm in diameter, and the majority of D5/CR double-labeled dendrites had diameters between 0.4 and 0.6 μm. These results indicate that D5-IR is not found preferentially in small (distal) or large (proximal) caliber CR dendrites.
Figure 10.
Figure 10.
Electron micrographs illustrating the distribution of D5-IR in serial sections of a CR-labeled dendrite. CR immunogold label is present throughout the dendrite and is identified by black arrowheads in panel (A). Patches of D5-IR have been identified as intracellular (black arrow) or associated with the plasma membrane (white arrow). In panel (A), the D5-IR is present and associated with the plasma membrane, whereas in panels (C, D), it is intracellular and associate with a mitochondria. No synapses are visible until panel (F), where an asymmetric synapse (white asterisk) is cut tangentially. In panels (GH), the CR dendrite receives 2 asymmetric synapses and 1 symmetric (black asterisk). One terminal forming an asymmetric synapse contains D5-IR (black arrow) visible in panel (G). Scale bar is 500 nm.
Figure 11.
Figure 11.
Electron micrographs illustrating the density of asymmetric synapses onto a PV-labeled dendrite which also contains D1-IR. PV immunogold is present throughout the serial sections of this dendrite and is indicated by black arrowheads in panel (A). D1-IR associated with the plasma membrane is present in panels (B and C) (white arrows). Over a total perimeter length of 19.8 μm, this PV-labeled dendrite received 7 asymmetric synapses (white asterisks) and has a density of 0.35 asymmetric synapses per micron of dendritic perimeter. One of the axon terminals making a synaptic contact onto this PV-labeled dendrite also contains D1-IR associated with the plasma membrane (white arrow, panel F).
Figure 12.
Figure 12.
Electron micrographs illustrating the density of asymmetric synapses onto a CR-labeled dendrite which also contains D5-IR. CR immunogold label is identified by black arrowheads and is labeled throughout the dendrite. Patches of D5-IR have been identified as associated with the plasma membrane (white arrows). D5-IR begins to appear in panel (D), where it is associated with the plasma membrane, and remains visible until panel (G). Over a total perimeter length of 10.2 μm, this CR-labeled dendrite received 1 asymmetric contact (white asterisk) and has a density of 0.1 asymmetric synapses per micron of dendritic perimeter. Scale bar is 500 nm.
Figure 13.
Figure 13.
(A) Graphical representation of the relationship between D1R stimulation and pyramidal cell activity (green) or WM performance (black). Different levels of D1R stimulation are indicated by numbers on the x-axis. Point 1 represents no D1R stimulation, resulting in very little pyramidal cell output and poor WM performance. Point 2 represents low levels of D1R stimulation, with strong pyramidal cell activity but with suboptimal WM performance. Point 3 represents moderate levels of D1R stimulation. At this point, pyramidal cell activity is lower, but WM performance is optimal. Finally, point 4 represents high levels of D1R stimulation, and both pyramidal cell activity and WM performance are diminished. Note that although both pyramidal cell activity and WM performance have inverted-U relationships with D1R activation, the cell activity peak is left shifted compared with WM performance. (B) Simplified circuit model of the relationship between CR interneurons (red), PV interneurons (blue), and pyramidal cells (green). Panel 1 represents activity levels with there is no D1R stimulation. Panel 2 represents cellular activity levels at low D1R stimulation. D5 receptors on CR interneurons would be preferentially activated, enhancing their output, resulting in decreased PV interneuron activity, and disinhibiting the pyramidal cell. Panel 3 represents cellular activity levels at moderate D1R stimulation. Whereas D5 receptors on CR interneurons are still being activated, D1 receptors on PV interneurons are also now stimulated, allowing the PV interneurons to overcome some of the inhibition by CR interneurons which in turn results in decreased pyramidal cell activity. Finally, panel 4 represents cellular activity levels at high D1R stimulation. D1 receptors on the PV interneurons are now maximally stimulated, overriding most of the inhibition from CR interneurons. PV interneuron activity will be greatly enhanced, resulting in a dramatic reduction in pyramidal cell output.

Similar articles

Cited by

References

    1. Bacci A, Rudolph U, Huguenard JR, Prince DA. Major differences in inhibitory synaptic transmission onto two neocortical interneuron subclasses. J Neurosci. 2003;23:9664–9674. - PMC - PubMed
    1. Bordelon-Glausier JR, Khan ZU, Muly EC. Quantification of D1 and D5 dopamine receptor localization in layers I, III, and V of Macaca mulatta prefrontal cortical area 9: coexpression in dendritic spines and axon terminals. J Comp Neurol. 2008;508:893–905. - PMC - PubMed
    1. Brozoski TJ, Brown RM, Rosvold HE, Goldman PS. Cognitive deficit caused by regional depletion of dopamine in prefrontal cortex of rhesus monkey. Science. 1979;205:929–932. - PubMed
    1. Celio MR. Parvalbumin in most gamma-aminobutyric acid-containing neurons of the rat cerebral cortex. Science. 1986;231:995–997. - PubMed
    1. Centonze D, Grande C, Saulle E, Martin AB, Gubellini P, Pavon N, Pisani A, Bernardi G, Moratalla R, Calabresi P. Distinct roles of D1 and D5 dopamine receptors in motor activity and striatal synaptic plasticity. J Neurosci. 2003;23:8506–8512. - PMC - PubMed

Publication types