. 2008;18(12):1157-74.
doi: 10.1002/hipo.20518.

Grid cells and theta as oscillatory interference: theory and predictions

Affiliations

Grid cells and theta as oscillatory interference: theory and predictions

Neil Burgess. Hippocampus. 2008.

Abstract

The oscillatory interference model [Burgess et al. (2007) Hippocampus 17:801-802] of grid cell firing is reviewed as an algorithmic level description of path integration and as an implementation level description of grid cells and their inputs. New analyses concern the relationships between the variables in the model and the theta rhythm, running speed, and the intrinsic firing frequencies of grid cells. New simulations concern the implementation of velocity-controlled oscillators (VCOs) with different preferred directions in different neurons. To summarize the model, the distance traveled along a specific direction is encoded by the phase of a VCO relative to a baseline frequency. Each VCO is an intrinsic membrane potential oscillation whose frequency increases from baseline as a result of depolarization by synaptic input from speed modulated head-direction cells. Grid cell firing is driven by the VCOs whose preferred directions match the current direction of motion. VCOs are phase-reset by location-specific input from place cells to prevent accumulation of error. The baseline frequency is identified with the local average of VCO frequencies, while EEG theta frequency is identified with the global average VCO frequency and comprises two components: the frequency at zero speed and a linear response to running speed. Quantitative predictions are given for the inter-relationships between a grid cell's intrinsic firing frequency and grid scale, the two components of theta frequency, and the running speed of the animal. Qualitative predictions are given for the properties of the VCOs, and the relationship between environmental novelty, the two components of theta, grid scale and place cell remapping.


Figures

Figure 1
Figure 1
Oscillatory interference patterns. Effect of addition (a, b) and multiplication (c, d) of a sinusoidal (a, c) or punctate (b, d) “active” 9Hz oscillation (red, frequency fa=9Hz) with a sinusoidal “baseline” 8 Hz oscillation (blue, frequency fb=9Hz). Note that all of the combined oscillations (black) have raised areas of similar extents, but the peaks of the combined oscillation occur over different ranges of phase relative to the baseline oscillation (black diamonds) for the two the types of active oscillation (a,b vs c,d). Both interfering oscillations have range [0, 1] before being combined. Sinusoidal oscillations are: V(t)=(1+cos{2πft})/2, with f = 8 or 9. Punctate oscillations are: V(t)50. Figure 1a is adapted from Burgess et al. (2007).
Figure 2
Figure 2
Linear interference patterns in 2D. a) Interference between a velocity-controlled oscillator (VCO) and a baseline oscillation during constant velocity runs from the origin (bottom left). Expanded view (b-d) shows the baseline oscillation (c) and the VCO (d, grey arrow shows preferred direction). Both component oscillations are sinusoidal and the combined oscillation is the thresholded sum (a, b). See Details below and Burgess et al. (2007). e) The firing of a neuronal VCO as the rat follows a 10min foraging path (grey line) in a square box. The VCO fires spikes at the peaks of its membrane potential oscillation (MPO). The locations of spike firing are show colored by the phase of firing relative to the baseline oscillation. See Details below. f) The firing of the neuronal VCO in (e) when its MPO is modulated by the baseline oscillation and a firing threshold of 0.5 is applied. Details: The baseline oscillation is Vb(t)=(1+cos{2πfbt})/2, the VCO is: Va(t)=(1+cos{2πfat})/2, where fb = 8, fa= fb + βv(t).d, β=0.05, and d is a unit vector in the preferred direction (rightwards). In (a-d) ν(t) is a constant 30cm/s to the location of each pixel. The thresholded sum: [Va(t)+Vb(t)-F]+ is shown in (a), with threshold F=1. In (e-f) ν(t) is the velocity of the rat, spikes are fired at the peaks of Va(t) in (e) and colored to show phase of firing relative to Vb(t). In (f) spikes are fired as in (e), but only if Va(t)*Vb(t) exceeds a firing threshold F=0.5. Color bar (top right) shows amplitude (0-1) and phase. Figure 2a is adapted from Burgess et al. (2007).
Figure 3
Figure 3
Velocity-controlled oscillators (VCOs) could be implemented in dendrites (a, red rectangles) or neurons (b, red circles). In both cases the VCOs are driven by a speed modulated head-direction cell or population of cells (firing rates rHDCi = v.di, where ν is the rat’s current velocity and di is the preferred direction for the ith VCO). (a) An implementation in which dendritic VCOs (sinusoidal dendritic MPOs with frequency fai) sum with the baseline input (frequency fb, blue line) and the interference patterns from different VCOs are multiplied at the grid cell soma (pale blue circle), see equation 6 and Figure 4. (b) An example in which neuronal VCOs (having sinusoidal MPOs with frequency fai) fire spikes with frequency fai. These spikes affect the membrane potential of the grid cell (modeled as a leaky-integrate and fire neuron, pale blue circle) whose membrane potential is also modulated by the baseline input (frequency fb, blue line). Figure 3a is adapted from Burgess et al. (2007).
Figure 4
Figure 4
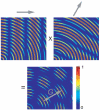
Two linear interference patterns with preferred directions differing by 60° (grey arrows, left and middle) combine to produce a triangular grid (right, grid scale = G). The linear interference patterns are the thresholded sum of a velocity-controlled oscillator (VCO) and a baseline oscillation during constant velocity runs from the origin (bottom left), see Figure 2 for details. These patterns are multiplied to produce the grid pattern (right). The colorbar shows amplitude.
Figure 5
Figure 5
Illustration of interference between trains of excitatory post-synaptic potentials (EPSPs) during leaky temporal integration within a cell. The effect of individual trains of EPSPs at 9Hz (blue) and 10Hz (red) on the somatic membrane potential, modelled as a leaky integrator with exponential decay (see equations 7 and 8, T= 20ms). The upper plots (black) shows the effect of both trains combined by addition or multiplication. In both cases the higher peaks in the combined oscillation occur at the time of the later of the two contributing peaks, i.e. at the higher frequency prior to the centre of the region of constructive interference and at the lower frequency following it.
Figure 6
Figure 6
Illustration of two neural velocity-controlled oscillators (VCOs, red circles) providing input to a grid cell (blue circle): the configuration shown in Figure 3b. The grid cell’s membrane potential performs leaky temporal integration of the EPSPs from these inputs (time constant T=25ms), and is modulated by a baseline-frequency input (8Hz, blue arrow; sinusoid coloured by phase). The grid cell fires spikes at peaks of its MPO which exceed a firing threshold F=1.5. The above plots show the locations at which the two VCOs with different preferred directions (grey arrow) fired spikes on the path of a rat foraging for 10mins in a cylinder. Spike locations are coloured according to their phase of firing relative to the baseline oscillation (see Figure 2e for details). The grid cell operates as a coincidence detector: firing whenever inputs arrive from both VCOs at the same phase (i.e. locations with spikes in the same colour in the two plots above). Such locations fall at the vertices of a triangular grid, with different firing phases corresponding to grids with different spatial offsets. Modulated by the baseline oscillation selects a specific range of phases for firing and a thus a specific triangular grid (black circles).
Figure 7
Figure 7
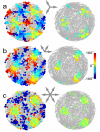
Grid cell firing under different configurations of velocity-controlled oscillator (VCO) inputs, without baseline frequency modulation (left), and with baseline frequency modulation (right). a) Three VCO inputs with preferred directions (grey arrows) evenly spaced around 360°. b) Three VCO inputs with grouped preferred directions. c) Six VCO inputs with evenly spaced preferred directions. Notice the three interleaved grids with firing phases differing by ±120° in the simulation without baseline frequency modulation and with three evenly spaced preferred directions (a, left); The location-dependence of firing phase in the case of grouped preferred directions (b); The removal of out-of-field spikes by the baseline frequency modulation (c). Spike locations are shown on the path of a rat foraging for 10mins in a cylinder coloured by their phase of firing relative to the baseline oscillation. Baseline frequency fb= 8Hz; time constant T=25ms; firing threshold F=2 for three inputs (a, b) and F=3 for six inputs (c). See main text and Figure 6 for details
Figure 8
Figure 8
Grid cell firing with directional velocity-controlled oscillator (VCO) inputs and baseline frequency modulation. Each directional VCO fires only when the current running direction matches its preferred direction (within 90°), thus only VCOs firing at above baseline frequency provide the active input fa to the grid cell. a) 3 clustered directional VCO inputs produces directionally-modulated firing (see polar plot, left). The simulation is as Figure 7b right, but with directional VCOs and a lower firing threshold F=1.3. b-d) 6 directional VCO inputs produces omin-directional firing, showing the effect of varying the time constant T and firing threshold F. Time constant T=25ms and firing threshold F=1.5 in (b); T=12.5ms, F=1.1 in (c) and T=6.25ms, F=1.1 in (d). The size of firing fields decreases with decreasing T and increasing F. To produce grid-like firing patterns the model simply requires the combination of T and F to be such that grid cell firing requires input from VCOs with more than one preferred direction. F must be lower for directional VCOs than non-directional VCOs (Figure 7) since half of them will not be firing spikes at any moment. Baseline frequency fb= 8Hz. Spike locations are shown on the path of a rat foraging for 10mins in a cylinder, coloured by their phase of firing relative to the baseline oscillation. See main text and Figure 6 for details.
Figure 9
Figure 9
Phase of firing on runs in opposing directions (black arrows) through a grid firing field. a) Grid cell with six directional velocity-controlled oscillator (VCO) inputs and baseline frequency modulation (as Figure 8b). Note the late to early phase precession relative to baseline for runs in both directions. b) Grid cell with six non-directionally modulated VCO inputs (as Figure 7c; with F=2 to match the extent of firing in a). Note that no overall phase precession is observed.

References

    1. Alonso A, Klink R. Differential electroresponsiveness of stellate and pyramidal-like cells of medial entorhinal cortex layer II. J.Neurophysiol. 1993;70:128–143. - PubMed
    1. Alonso A, Llinas RR. Subthreshold Na+-dependent theta-like rhythmicity in stellate cells of entorhinal cortex layer II. Nature. 1989;342:175–177. - PubMed
    1. Alyan S, McNaughton BL. Hippocampectomized rats are capable of homing by path integration. Behav.Neurosci. 1999;113:19–31. - PubMed
    1. Barry C, Hayman R, Burgess N, Jeffery KJ. Experience-dependent rescaling of entorhinal grids. Nat.Neurosci. 2007;10:682–684. - PubMed
    1. Barry C, Lever C, Hayman R, Hartley T, Burton S, O’Keefe J, et al. The boundary vector cell model of place cell firing and spatial memory. Rev.Neurosci. 2006;17:71–97. - PMC - PubMed

Publication types