. 2008 Jul-Aug;13(4):041303.
doi: 10.1117/1.2953185.

Molecular imaging with optics: primer and case for near-infrared fluorescence techniques in personalized medicine

Affiliations

Molecular imaging with optics: primer and case for near-infrared fluorescence techniques in personalized medicine

Eva M Sevick-Muraca et al. J Biomed Opt. 2008 Jul-Aug.

Abstract

We compare and contrast the development of optical molecular imaging techniques with nuclear medicine with a didactic emphasis for initiating readers into the field of molecular imaging. The nuclear imaging techniques of gamma scintigraphy, single-photon emission computed tomography, and positron emission tomography are first briefly reviewed. The molecular optical imaging techniques of bioluminescence and fluorescence using gene reporter/probes and gene reporters are described prior to introducing the governing factors of autofluorescence and excitation light leakage. The use of dual-labeled, near-infrared excitable and radio-labeled agents are described with comparative measurements between planar fluorescence and nuclear molecular imaging. The concept of time-independent and -dependent measurements is described with emphasis on integrating time-dependent measurements made in the frequency domain for 3-D tomography. Finally, we comment on the challenges and progress for translating near-infrared (NIR) molecular imaging agents for personalized medicine.


Figures

Fig. 1
Fig. 1
Schematic of the basic instruments used in molecular imaging with radioisotopes. (a) illustrates a 2-D array of collimated scintillation crystals and PMTs used to image gamma photons. The scintigraphy array (top) produces a 2-D image of the gamma source, while the pinhole aperture on the bottom array restricts the detection of spatially distributed gamma rays such that a series of scintigrams can be used to produce a 3-D reconstruction of the gamma source through single photon emission tomography. (b) illustrates the ring of collimated scintillation crystals and PMTs used to collect coinciding incidents of annihilation photons that are subsequently reconstructed using positron emission tomography algorithms.
Fig. 2
Fig. 2
Schematic of the basic instrumentation used for molecular optical imaging. (a) illustrates a basic bioluminescence imaging system in which a CCD camera collects bioluminescent photons. (b) illustrates the basic setup required to image fluorescent photons. The laser source is required to excite the fluorophore, thus producing a red-shifted emission signal detected by the CCD camera.
Fig. 3
Fig. 3
Bioluminescence in a preclinical model of a breast cancer cell line (SKBr-3) transfected to produce luciferase. The bioluminescent image was obtained five minutes after IV injection of 100 μL of 100-μM D-luciferin. The bioluminescent image was acquired with five minutes of integration time and is overlaid on the white light image. Image reproduced from Sampath et al. (Color online only.)
Fig. 4
Fig. 4
A Jablonski diagram illustrating the fluorescence process in which an excitation photon (Ex) is absorbed, causing the fluorophore to enter a higher vibrational state. If the fluorophore undergoes radiative relaxation (D), an emission photon is emitted. The fraction of absorbed photons that are reemitted as fluorescence is known as the quantum efficiency.
Fig. 5
Fig. 5
Comparison of autofluorescence at two excitation wavelengths: (a) autofluorescence levels in a mouse illuminated with 780-nm excitation light. A vial containing 50 nM of EGF-IRDye® 800 cw is also illuminated for comparison; (b) autofluorescence levels in a mouse illuminated with 690-nm excitation light. A vial containing 50 nm of EGF-Cy5.5 is also illuminated for comparison. The autofluorescence in (a), the NIR image, is significantly lower than that in (b) the red fluorescent images. Adapted from Adams et al.
Fig. 6
Fig. 6
Schematic illustrating the general trends of the major noise floor contributors in optical imaging. (a) As the optical density of the filters increase, the intensity of the excitation light leakage decreases, thus permitting lower concentrations of dye to be seen. (b) As the excitation light wavelength increases, the intensity of the autofluorescent signal decreases, also permitting lower concentrations of the desired fluorophore to be imaged.
Fig. 7
Fig. 7
(a) White light, (b) nuclear scintigram, and (c) fluorescence-enhanced optical image of a typical nude mouse xenograph bearing an integrin-positive (M21) tumor in the left thigh (right side: anterior view is displayed by figure) and an integrin-negative (M21-L) tumor in the right thigh (left side: anterior view is displayed by figure). The digital photograph of the animal depicts the ROIs selected for the collection of intensity signals either in the positive tumor, negative tumor, or normal tissue regions. The nuclear and optical images show a low signal in the negative (M21-L tumor left side), a high signal in the bladder indicating wash-out of the dye, and a high signal in the integrin positive (M21 tumor right side). The optical image was plotted in a pseudo-color format for enhancement of the intensity scale in the tumor and background. The nuclear image was also adjusted with the same color scale for better discrimination between the several levels of gray provided by the 16-bit image. The nuclear image was acquired after 15 min of integration, whereas the optical image was acquired for a total exposure time of 800 ms. Adapted from Houston et al. (Color online only.)
Fig. 8
Fig. 8
Comparison of target-to-background ratio (TBR) in two different dye conjugates 24 h after injection in MDA-MB-468 tumor-bearing mice. Images of mouse with an injection of 1 nmol of (a) EGF-IRDye® 800 cw and (b) EGF-Cy5.5. (a) NIR dye conjugate has significantly higher TBR than (b) red fluorescent dye. Adapted from Adams et al. (Color online only.)
Fig. 9
Fig. 9
Examples of type of input and detected signals for (a) and (c) frequency- and (b) and (d) time-domain measurements. (a) Propagation of intensity modulated excitation light undergoes amplitude attenuation and phase shift as it propagates through the tissue medium. The generated fluorescent signal modulates at the same frequency and undergoes further amplitude and phase attenuation as it propagates to the detector. (c) Comparison of the initial input signal to the detected signal with the measurable ac, dc, and θ components. (b) Illustration of the broadening of a pulse of excitation light as it propagates across the tissue. The generated pulse of fluorescence light also broadens as it propagates to the detector. (c) Comparison of the initial input signal to the detected signal. The ac and θ components can be obtained via Fourier transform.
Fig. 10
Fig. 10
Schematic of the FDPM instrumentation: (a) light source, (b) light delivery and detection, and (c) data acquisition and analysis. L is the detected modulated signal, G is the heterodyning signal with the offset frequency component, and S is the resulting mixed signal. Adapted from Sun et al.
Fig. 11
Fig. 11
(a) schematic of the homodyne intensified CCD camera system for frequency-domain measurements. The dashed box outlines the blown up region shown in (b). (b) Blow up of the intensifier, demonstrating the major regions of the intensifier and the homodyne mixing of L(x,y) and G.
Fig. 12
Fig. 12
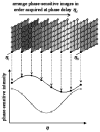
Schematic illustrating homodyne data acquisition. For each phase delay introduced between L(x,y) and G, an image is acquired. When plotted as a function of phase delay, the resulting intensities illustrate the modulated mixed signal S(x,y), which yield amplitude and phase via Fourier transform. Reproduced from Thompson and Sevick-Muraca.
Fig. 13
Fig. 13
(a) Optical density of 830-nm interference filter as a function of incident angle (from Andover with permission). (b) Optical density of Kaiser holographic filter as a function of incident angle (reproduced from the Handbook of Vibrational Spectroscopy with permission).
Fig. 14
Fig. 14
Transmission ratio of (a) dc intensity [R(Idc)], and (b) ac amplitude [R(Iac)], computed from filter combination (holographic—bandpass— holographic filters) as a function of r, the distance from the center of photocathode, as shown by C. Black and white bars indicate out-of-band to in-band ratio of the imaging system with and without collimating optics, respectively. Error bars represent standard deviations of intensity with ROI. Adapted from Hwang et al.
Fig. 15
Fig. 15
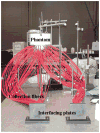
Schematic of a clinically relevant breast-shaped phantom utilizing fiber optics to collect and deliver fluorescent light to the intensified CCD system. Adapted from Godavarty et al.
Fig. 16
Fig. 16
Anterior (top) and lateral (bottom) views of reconstructed tissue phantoms illustrating the effect of mesh size on the accuracy of optical tomography. The actual target (0.55 cm3 each) locations are located about 1.30 cm deep, as indicated by the solid red circles. The TBR is 1:0, and the reconstructed targets are indicated by blue points at the corresponding nodes in the finite-element mesh. The reconstruction was performed on (a) a finely discretized finite-element mesh with 11,906 unknowns, and (b) a coarse discretized finite-element mesh with 3857 unknowns. As is evident, the finer mesh produced more accurate results. Reproduced from Godavarty et al. (Color online only.)
Fig. 17
Fig. 17
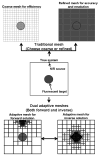
Illustrates the meshing options available for tomographic reconstructions. The middle row represents the true system to be reconstructed. The top row illustrates the mesh choice, coarse or refined, that has traditionally been available. The coarse grid is more efficient to solve, but at the cost of accuracy and resolution (see Fig. 16 for a real example), while the refined mesh offers accuracy and resolution but requires significantly more computational resources, and may be unsolvable due to the increase in the ill-posed nature of the problem. The recent development of utilizing dual adaptive meshes offers the advantage of refinement in regions where it is needed without the unnecessary build-up in unknowns. In this approach, the meshes are refined between iterations when needed.
Fig. 18
Fig. 18
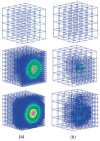
Example of adaptive mesh evolution for the (a) forward and (b) inverse problems in the reconstruction of phantoms containing a single fluorescent target. Meshes are shown at the first, 11th, and 22nd Gauss-Newton iterations. The initial meshes started with 64 hexahedral elements. After five automated refinements, the final forward mesh had 116,936 elements, and the inverse mesh had 1016 elements. Reproduced from Joshi et al.
Fig. 19
Fig. 19
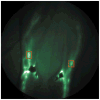
Image acquired of real-time lymph transport in the legs. The black marks are small pieces of plastic used to cover the injection sights. The green streaks are lymphatic vessels, and the bright spots in the red squares are packets of lymph that are transiting from the ankles to the inguinal nodes. (Color online only.)

Similar articles

Cited by

References

    1. Weissleder R. Molecular imaging in cancer. Science. 2006;312(5777):1168–1171. - PubMed
    1. Herschman HR. Molecular imaging: looking at problems, seeing solutions. Science. 2003;302(5645):605–608. - PubMed
    1. Rudin M, Weissleder R. Molecular imaging in drug discovery and development. Nat Rev Drug Discovery. 2003;2(2):123–131. - PubMed
    1. Blasberg RG, Tjuvajev JG. Molecular-genetic imaging: current and future perspectives. J Clin Invest. 2003;111(11):1620–1629. - PMC - PubMed
    1. Massoud TF, Gambhir SS. Molecular imaging in living subjects: seeing fundamental biological processes in a new light. Genes Dev. 2003;17(5):545–580. - PubMed

Publication types

MeSH terms