

doi: 10.1117/1.2978060.
Imaging performance of a miniature integrated microendoscope
Affiliations
- PMID: 19021400
- PMCID: PMC3129652
- DOI: 10.1117/1.2978060
Item in Clipboard
Imaging performance of a miniature integrated microendoscope
J Biomed Opt.
2008 Sep-Oct.
Abstract
An integrated miniature multi-modal microscope (4M device) for microendoscopy was built and tested. Imaging performance is evaluated and imaging results are presented for both fluorescence and reflectance samples. Images of biological samples show successful imaging of both thin layers of fixed cells prepared on a slide as well as thick samples of excised fixed porcine epithelial tissue, thus demonstrating the potential for in vivo use.
Figures

Rendered design of the 4M device that illustrates optical components mounted on the MOT substrate. In the future completed device (not shown), the image sensor is to be mounted on a PCB and attached to the 4M device walls.

SEM of the micromount lens holder assembled from metal LIGA parts. The lens aperture on the left is 0.8 mm and centers the spherical lens surface. A spring-loaded back plate shown at the right secures the lens. These layers and spacer layers in between are stacked and pinned together. The total width of each mount is 2.0 mm.
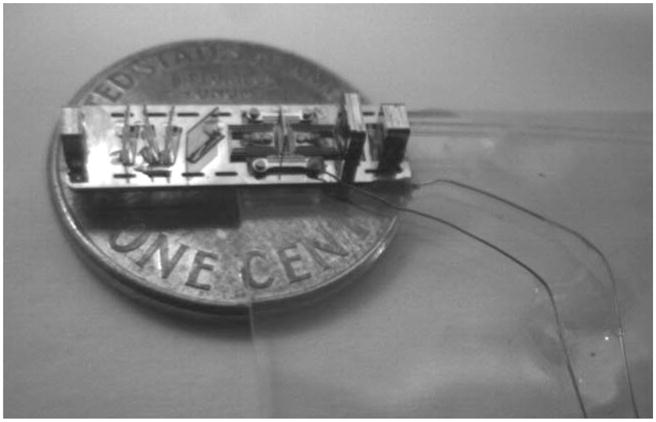
Assembled 4M device shown above a United States penny for scale. The system incorporates the micromounted lens, hybrid printed lenses, beamsplitter, illumination optics, and fiber holder. The image is formed at the location where the detector will be integrated in future devices. This intermediate image is relayed by optical bench relay lenses to a CCD camera for testing purposes.
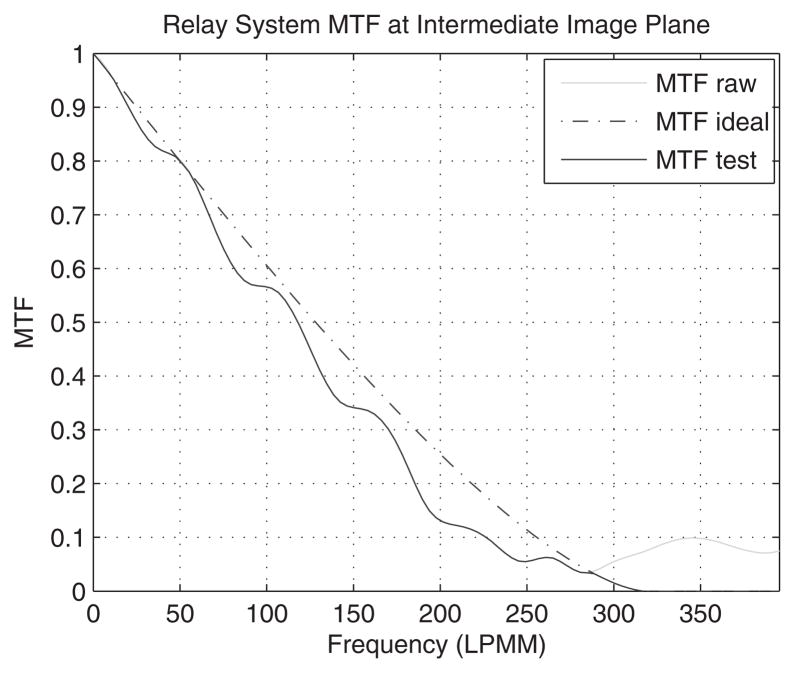
Plot of the MTF of the relay optical system used in the 4M device imaging experiments. The dashed curve shows the ideal MTF for the relay system based on the NA. The solid dark line shows the calculated (measured) MTF of the relay system. The solid light line is the noise level of the measured raw data. Note that the frequency is in the object space of the relay system, which corresponds to the image space of the 4M device. Based on this measurement, the relay system was determined to be diffraction limited.

Plot of the MTF of the combined relay and 4M optical systems measured by the tilted-edge method. The dashed line represents the ideal MTF. The solid dark curve is the calculated MTF, and the solid light segment (raw data) was assumed to be noise and was blocked by a threshold level. The computed Strehl Ratio was 0.67 for the device with 0.4 NA.
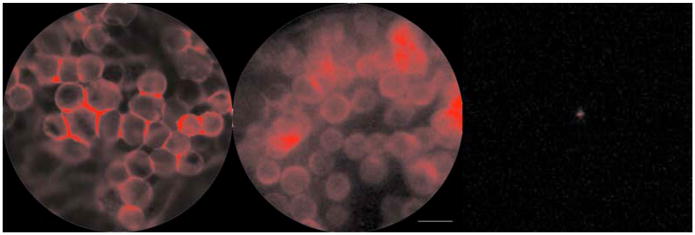
Widefield images of cells labeled with fluorescent quantum dots imaged with the 4M device (center) and with a Zeiss Axiovert 100M for comparison (left). Cell membranes are clearly visible in each image. A control sample with nonspecific IgG labeling is shown on the right. The scale bar is 25 μm.

Widefield image of cells imaged in reflectance labeled with gold nanoparticles. The image taken with the 4M device (right) shows the significance of the internal lens surface reflections. The bright region on the right of the image is due to a single surface reflection from an AR-coated lens. A similar image taken with a Zeiss Axiovert 100M is shown (left) for comparison. Black circular masks limit the FOV to 250 μm for each image.

Widefield fluorescent images of porcine epithelial tissue labeled with quantum dots taken with a Zeiss AxioImager Z1 (left) and with the 4M device (center). Squamous epithelial cells can be appreciated in both images. A control image is shown on the left. The scale bar is 25 μm.
References
-
- American Cancer Society. Cancer Facts and Figures, 2006. 2006 http://cancer.org.
-
- Neil MAA, Juskaitis R, Wilson T. Method of obtaining optical sectioning by using structured light in a conventional microscope. Opt Lett. 1997;22:1905–1907. - PubMed
-
- Gmitro A, Aziz D. Confocal microscopy through a fiber-optic imaging bundle. Opt Lett. 1993;18:565–567. - PubMed
-
- Delaney P, Harris M, King R. Fibre-optic laser scanning confocal microscope suitable for fluorescence imaging. Appl Opt. 1994;33:573–577. - PubMed
-
- Kiesslich R, Gossner L, Goetz M, Dahlmann A, Vieth M, Stolte M, Hoffman A, Jung M, Nafe B, Galle P, Neurath M. In vivo histology of Barrett’s esophagus and associated neoplasia by confocal laser endomicroscopy. Clin Gastroenterol Hepatol. 2006;4:979–987. - PubMed
Publication types
MeSH terms
Grants and funding
LinkOut - more resources
Full Text Sources
Other Literature Sources
