

Direct estimation of evoked hemoglobin changes by multimodality fusion imaging
- PMID: 19021411
- PMCID: PMC2718838
- DOI: 10.1117/1.2976432
Direct estimation of evoked hemoglobin changes by multimodality fusion imaging
Abstract
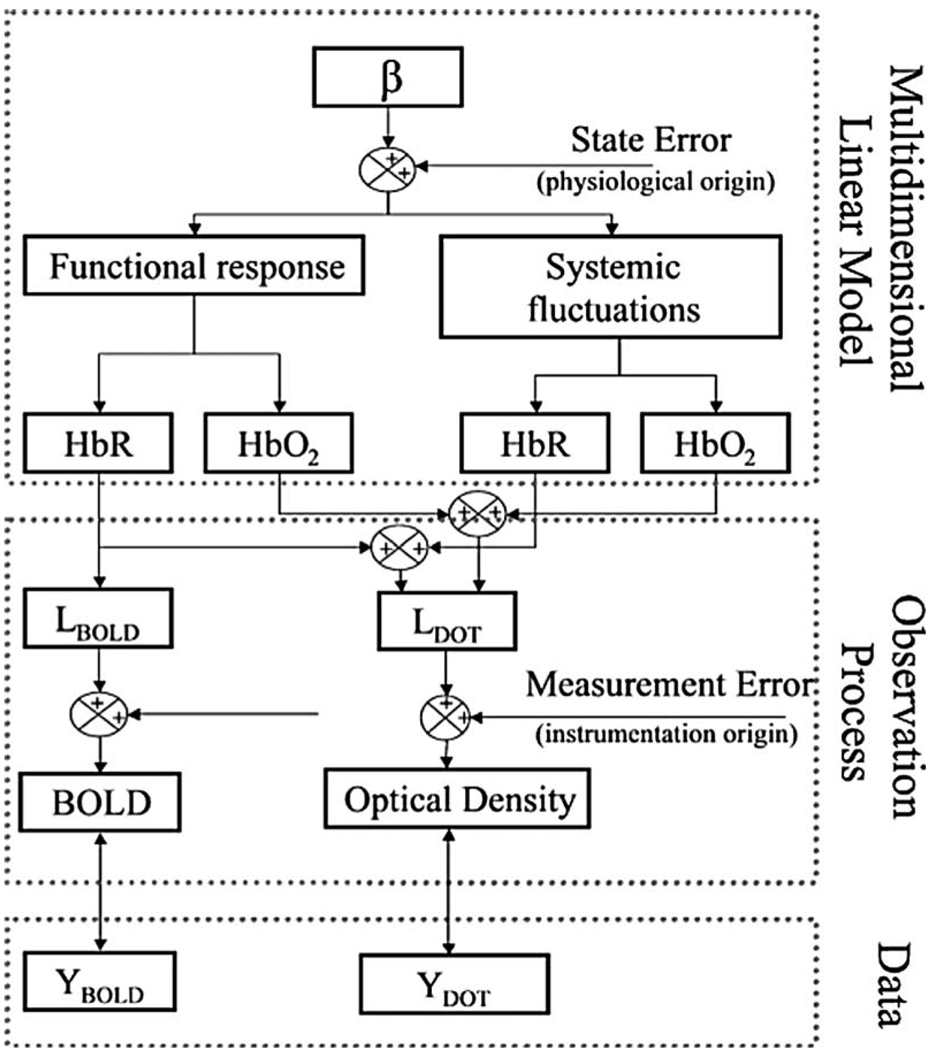
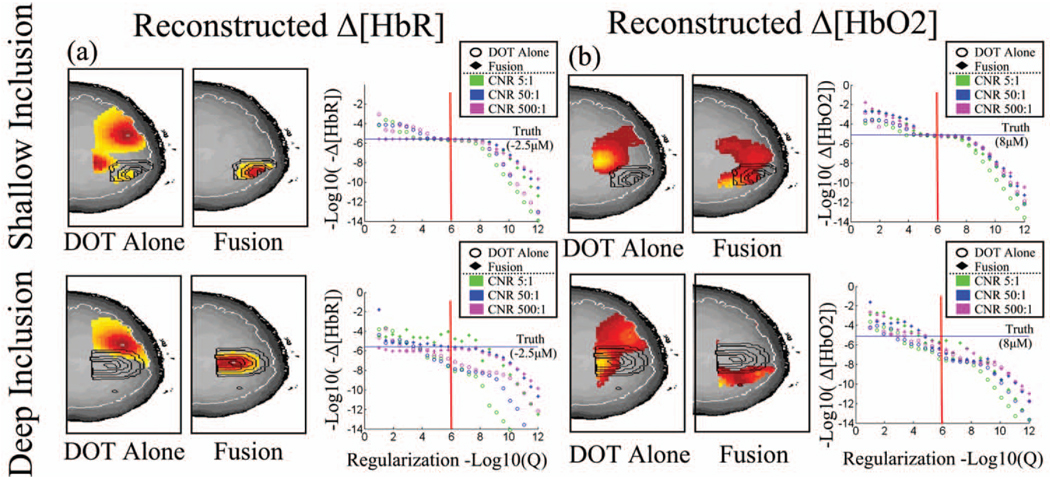
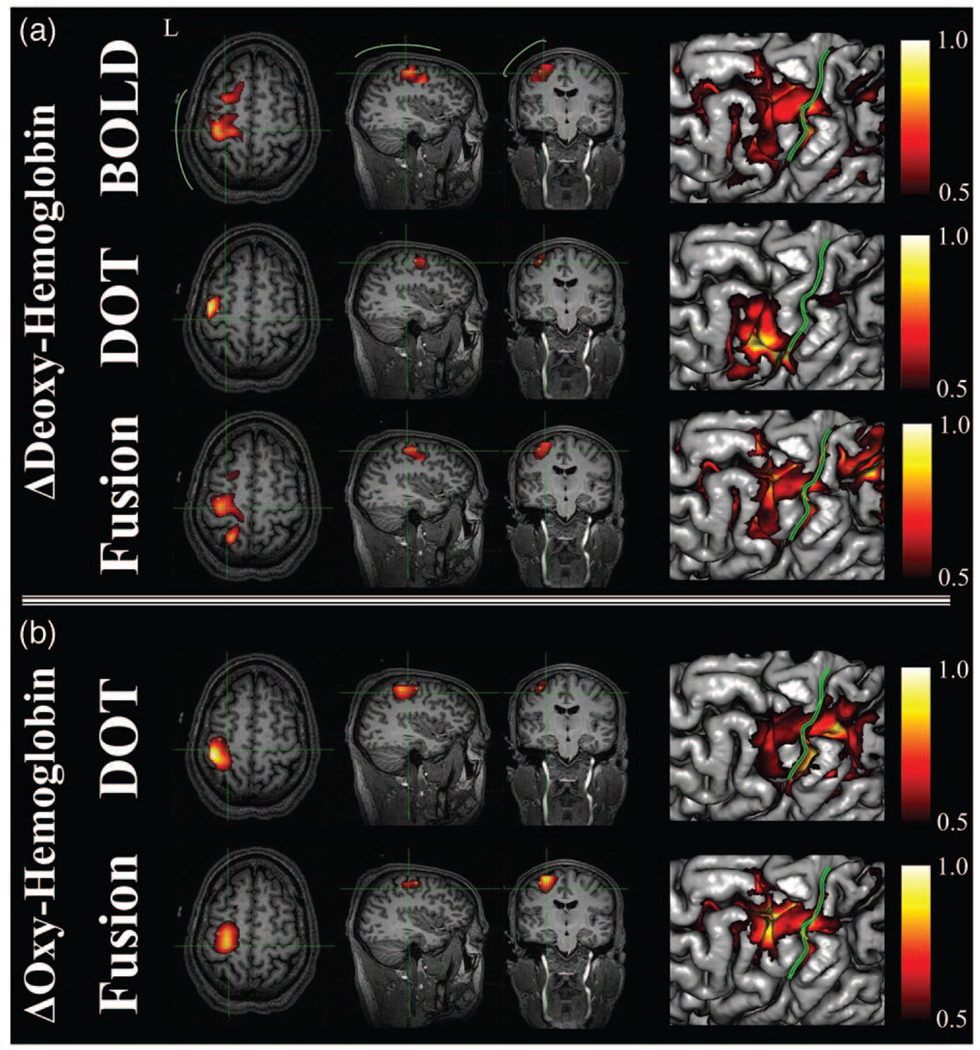
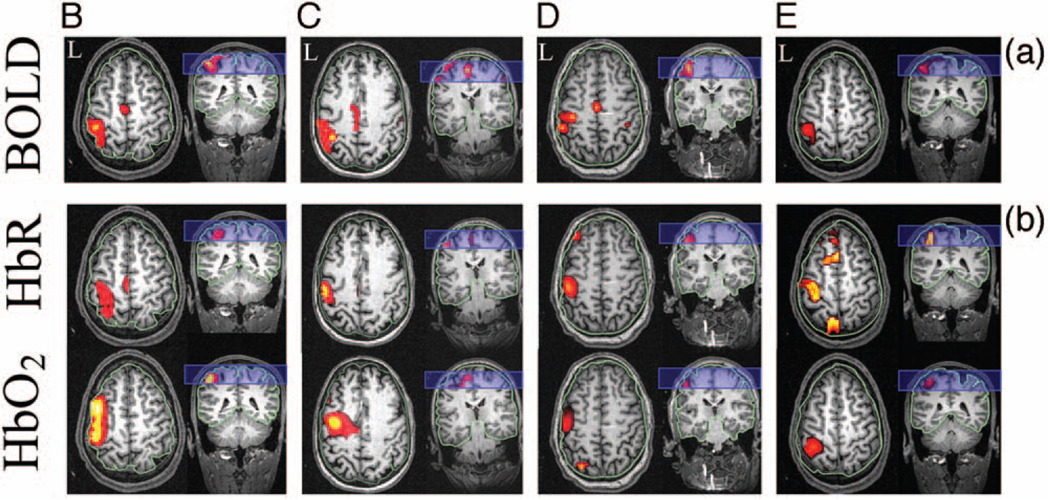
In the last two decades, both diffuse optical tomography (DOT) and blood oxygen level dependent (BOLD)-based functional magnetic resonance imaging (fMRI) methods have been developed as noninvasive tools for imaging evoked cerebral hemodynamic changes in studies of brain activity. Although these two technologies measure functional contrast from similar physiological sources, i.e., changes in hemoglobin levels, these two modalities are based on distinct physical and biophysical principles leading to both limitations and strengths to each method. In this work, we describe a unified linear model to combine the complimentary spatial, temporal, and spectroscopic resolutions of concurrently measured optical tomography and fMRI signals. Using numerical simulations, we demonstrate that concurrent optical and BOLD measurements can be used to create cross-calibrated estimates of absolute micromolar deoxyhemoglobin changes. We apply this new analysis tool to experimental data acquired simultaneously with both DOT and BOLD imaging during a motor task, demonstrate the ability to more robustly estimate hemoglobin changes in comparison to DOT alone, and show how this approach can provide cross-calibrated estimates of hemoglobin changes. Using this multimodal method, we estimate the calibration of the 3 tesla BOLD signal to be -0.55%+/-0.40% signal change per micromolar change of deoxyhemoglobin.
Figures
Similar articles
-
Quantitative spatial comparison of diffuse optical imaging with blood oxygen level-dependent and arterial spin labeling-based functional magnetic resonance imaging.J Biomed Opt. 2006 Nov-Dec;11(6):064018. doi: 10.1117/1.2400910. J Biomed Opt. 2006. PMID: 17212541 Free PMC article.
-
Multi-subject and multi-task experimental validation of the hierarchical Bayesian diffuse optical tomography algorithm.Neuroimage. 2016 Jul 15;135:287-99. doi: 10.1016/j.neuroimage.2016.04.068. Epub 2016 May 3. Neuroimage. 2016. PMID: 27150232
-
Calibrating the BOLD signal during a motor task using an extended fusion model incorporating DOT, BOLD and ASL data.Neuroimage. 2012 Jul 16;61(4):1268-76. doi: 10.1016/j.neuroimage.2012.04.036. Epub 2012 Apr 23. Neuroimage. 2012. PMID: 22546318 Free PMC article.
-
In Vivo Observations of Rapid Scattered Light Changes Associated with Neurophysiological Activity.In: Frostig RD, editor. In Vivo Optical Imaging of Brain Function. 2nd edition. Boca Raton (FL): CRC Press/Taylor & Francis; 2009. Chapter 5. In: Frostig RD, editor. In Vivo Optical Imaging of Brain Function. 2nd edition. Boca Raton (FL): CRC Press/Taylor & Francis; 2009. Chapter 5. PMID: 26844322 Free Books & Documents. Review.
-
Comparison of blood-oxygen-level-dependent functional magnetic resonance imaging and near-infrared spectroscopy recording during functional brain activation in patients with stroke and brain tumors.J Biomed Opt. 2007 Nov-Dec;12(6):062110. doi: 10.1117/1.2823036. J Biomed Opt. 2007. PMID: 18163813 Review.
Cited by
-
A quantitative comparison of NIRS and fMRI across multiple cognitive tasks.Neuroimage. 2011 Feb 14;54(4):2808-21. doi: 10.1016/j.neuroimage.2010.10.069. Epub 2010 Nov 1. Neuroimage. 2011. PMID: 21047559 Free PMC article.
-
Validation of the hypercapnic calibrated fMRI method using DOT-fMRI fusion imaging.Neuroimage. 2014 Nov 15;102 Pt 2(0 2):729-35. doi: 10.1016/j.neuroimage.2014.08.052. Epub 2014 Sep 6. Neuroimage. 2014. PMID: 25196509 Free PMC article.
-
Best practices for fNIRS publications.Neurophotonics. 2021 Jan;8(1):012101. doi: 10.1117/1.NPh.8.1.012101. Epub 2021 Jan 7. Neurophotonics. 2021. PMID: 33442557 Free PMC article.
-
Neuroimaging of the developing brain: taking "developing" seriously.Hum Brain Mapp. 2010 Jun;31(6):934-41. doi: 10.1002/hbm.21074. Hum Brain Mapp. 2010. PMID: 20496384 Free PMC article. Review.
-
Resting state functional connectivity of the whole head with near-infrared spectroscopy.Biomed Opt Express. 2010 Jul 28;1(1):324-336. doi: 10.1364/BOE.1.000324. Biomed Opt Express. 2010. PMID: 21258470 Free PMC article.
References
-
- Ogawa S, Lee TM, Kay AR, Tank DW. Brain magnetic resonance imaging with contrast dependent on blood oxygenation. Proc. Natl. Acad. Sci. U.S.A. 1990;87(24):9868–9872. - DOI - PMC - PubMed
-
- Delpy DT, Cope MC, Cady EB, Wyatt JS, Hamilton PA, Hope PL, Wray S, Reynolds EO. Cerebral monitoring in newborn infants by magnetic resonance and near infrared spectroscopy. Scand. J. Clin. Lab Invest Suppl. 1987;188:9–17. - PubMed
Publication types
MeSH terms
Substances
Grants and funding
LinkOut - more resources
Full Text Sources
Medical
