

Southern Ocean acidification: a tipping point at 450-ppm atmospheric CO2
- PMID: 19022908
- PMCID: PMC2596239
- DOI: 10.1073/pnas.0806318105
Southern Ocean acidification: a tipping point at 450-ppm atmospheric CO2
Abstract
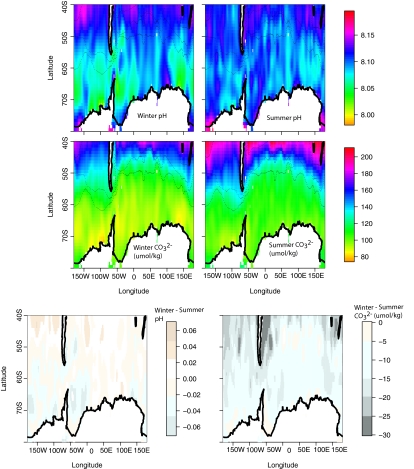
Southern Ocean acidification via anthropogenic CO(2) uptake is expected to be detrimental to multiple calcifying plankton species by lowering the concentration of carbonate ion (CO(3)(2-)) to levels where calcium carbonate (both aragonite and calcite) shells begin to dissolve. Natural seasonal variations in carbonate ion concentrations could either hasten or dampen the future onset of this undersaturation of calcium carbonate. We present a large-scale Southern Ocean observational analysis that examines the seasonal magnitude and variability of CO(3)(2-) and pH. Our analysis shows an intense wintertime minimum in CO(3)(2-) south of the Antarctic Polar Front and when combined with anthropogenic CO(2) uptake is likely to induce aragonite undersaturation when atmospheric CO(2) levels reach approximately 450 ppm. Under the IPCC IS92a scenario, Southern Ocean wintertime aragonite undersaturation is projected to occur by the year 2030 and no later than 2038. Some prominent calcifying plankton, in particular the Pteropod species Limacina helicina, have important veliger larval development during winter and will have to experience detrimental carbonate conditions much earlier than previously thought, with possible deleterious flow-on impacts for the wider Southern Ocean marine ecosystem. Our results highlight the critical importance of understanding seasonal carbon dynamics within all calcifying marine ecosystems such as continental shelves and coral reefs, because natural variability may potentially hasten the onset of future ocean acidification.
Conflict of interest statement
The authors declare no conflict of interest.
Figures


Similar articles
-
Anthropogenic ocean acidification over the twenty-first century and its impact on calcifying organisms.Nature. 2005 Sep 29;437(7059):681-6. doi: 10.1038/nature04095. Nature. 2005. PMID: 16193043
-
Baseline monitoring of the western Arctic Ocean estimates 20% of Canadian basin surface waters are undersaturated with respect to aragonite.PLoS One. 2013 Sep 11;8(9):e73796. doi: 10.1371/journal.pone.0073796. eCollection 2013. PLoS One. 2013. PMID: 24040074 Free PMC article.
-
Aragonite undersaturation in the Arctic Ocean: effects of ocean acidification and sea ice melt.Science. 2009 Nov 20;326(5956):1098-100. doi: 10.1126/science.1174190. Science. 2009. PMID: 19965425
-
Ocean acidification: the other CO2 problem.Ann Rev Mar Sci. 2009;1:169-92. doi: 10.1146/annurev.marine.010908.163834. Ann Rev Mar Sci. 2009. PMID: 21141034 Review.
-
Natural and Anthropogenic Drivers of Acidification in Large Estuaries.Ann Rev Mar Sci. 2021 Jan;13:23-55. doi: 10.1146/annurev-marine-010419-011004. Epub 2020 Sep 21. Ann Rev Mar Sci. 2021. PMID: 32956015 Review.
Cited by
-
Strong time dependence of ocean acidification mitigation by atmospheric carbon dioxide removal.Nat Commun. 2019 Dec 6;10(1):5592. doi: 10.1038/s41467-019-13586-4. Nat Commun. 2019. PMID: 31811135 Free PMC article.
-
Threatened species drive the strength of the carbonate pump in the northern Scotia Sea.Nat Commun. 2018 Nov 2;9(1):4592. doi: 10.1038/s41467-018-07088-y. Nat Commun. 2018. PMID: 30390024 Free PMC article.
-
Sensitivities of marine carbon fluxes to ocean change.Proc Natl Acad Sci U S A. 2009 Dec 8;106(49):20602-9. doi: 10.1073/pnas.0813291106. Epub 2009 Dec 7. Proc Natl Acad Sci U S A. 2009. PMID: 19995981 Free PMC article.
-
Ocean acidification at high latitudes: potential effects on functioning of the Antarctic bivalve Laternula elliptica.PLoS One. 2011 Jan 5;6(1):e16069. doi: 10.1371/journal.pone.0016069. PLoS One. 2011. PMID: 21245932 Free PMC article.
-
In situ response of Antarctic under-ice primary producers to experimentally altered pH.Sci Rep. 2019 Apr 15;9(1):6069. doi: 10.1038/s41598-019-42329-0. Sci Rep. 2019. PMID: 30988340 Free PMC article.
References
-
- Caldeira K, Wickett ME. Anthropogenic carbon and ocean pH. Nature. 2003;425:365–365. - PubMed
-
- McNeil BI, Matear RJ. Climate change feedbacks on future oceanic acidification. Tellus Ser B Chem Phys Meteorol. 2007;59:191–198.
-
- Orr JC, et al. Anthropogenic ocean acidification over the twenty-first century and its impact on calcifying organisms. Nature. 2005;437:681–686. - PubMed
-
- Fabry VJ, Seibel BA, Feely R, Orr JC. Impacts of ocean acidification on marine fauna and ecosystem processes. ICES J Mar Sci. 2008;65:414–432.
-
- Raven J. Ocean acidification Due to Increasing Atmospheric Carbon Dioxide. London: Royal Soc; 2005.
Publication types
MeSH terms
Substances
LinkOut - more resources
Full Text Sources
Other Literature Sources
