

Phylogenetic dependency networks: inferring patterns of CTL escape and codon covariation in HIV-1 Gag
- PMID: 19023406
- PMCID: PMC2579584
- DOI: 10.1371/journal.pcbi.1000225
Phylogenetic dependency networks: inferring patterns of CTL escape and codon covariation in HIV-1 Gag
Abstract
HIV avoids elimination by cytotoxic T-lymphocytes (CTLs) through the evolution of escape mutations. Although there is mounting evidence that these escape pathways are broadly consistent among individuals with similar human leukocyte antigen (HLA) class I alleles, previous population-based studies have been limited by the inability to simultaneously account for HIV codon covariation, linkage disequilibrium among HLA alleles, and the confounding effects of HIV phylogeny when attempting to identify HLA-associated viral evolution. We have developed a statistical model of evolution, called a phylogenetic dependency network, that accounts for these three sources of confounding and identifies the primary sources of selection pressure acting on each HIV codon. Using synthetic data, we demonstrate the utility of this approach for identifying sites of HLA-mediated selection pressure and codon evolution as well as the deleterious effects of failing to account for all three sources of confounding. We then apply our approach to a large, clinically-derived dataset of Gag p17 and p24 sequences from a multicenter cohort of 1144 HIV-infected individuals from British Columbia, Canada (predominantly HIV-1 clade B) and Durban, South Africa (predominantly HIV-1 clade C). The resulting phylogenetic dependency network is dense, containing 149 associations between HLA alleles and HIV codons and 1386 associations among HIV codons. These associations include the complete reconstruction of several recently defined escape and compensatory mutation pathways and agree with emerging data on patterns of epitope targeting. The phylogenetic dependency network adds to the growing body of literature suggesting that sites of escape, order of escape, and compensatory mutations are largely consistent even across different clades, although we also identify several differences between clades. As recent case studies have demonstrated, understanding both the complexity and the consistency of immune escape has important implications for CTL-based vaccine design. Phylogenetic dependency networks represent a major step toward systematically expanding our understanding of CTL escape to diverse populations and whole viral genes.
Conflict of interest statement
The authors have declared that no competing interests exist.
Figures
 and
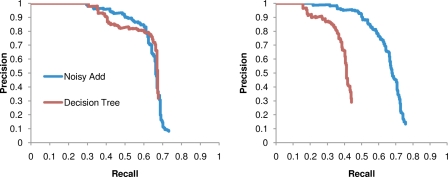
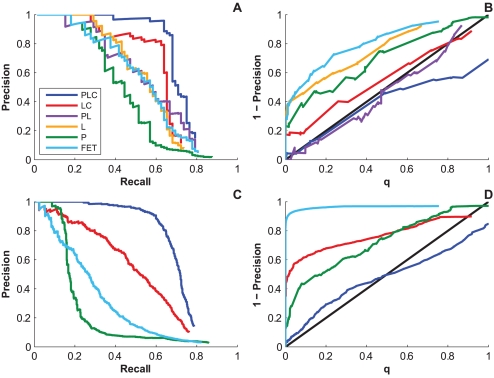
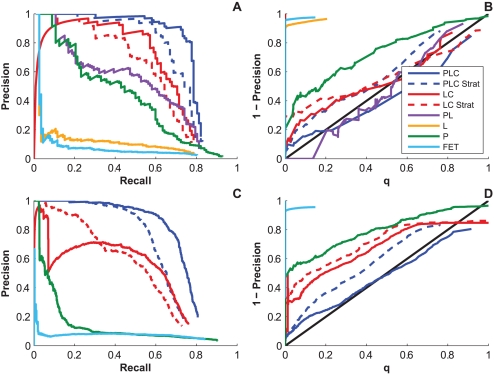
and  , respectively, on data stratified by clade. The curves reflect the combined results from the two strata.
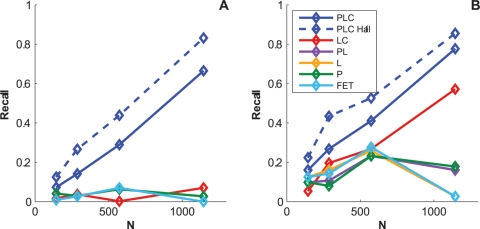
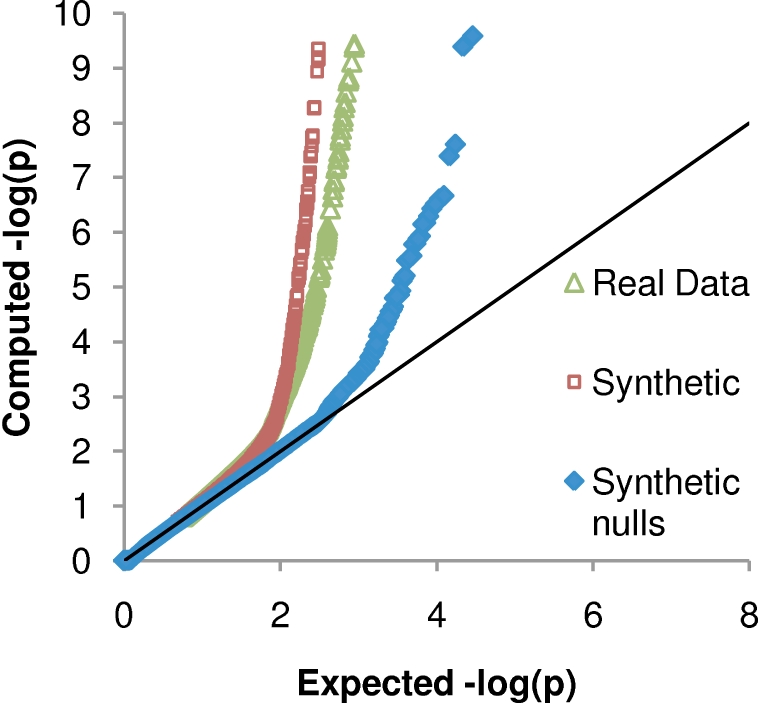
 on synthetic data generated using only associations that were identified from a cohort one half the size of the full cohort. The curves show how power is affected by the strengths of the planted associations.
References
-
- McMichael A, Rowland-Jones S. Cellular immune responses to HIV. Nature. 2001;410:980–987. - PubMed
-
- Carrington M, O'Brien S. The influence of HLA genotype on AIDS. Annu Rev Med. 2003;54:535–551. - PubMed
-
- Goulder P, Watkins D. HIV and SIV CTL escape: implications for vaccine design. Nat Rev Immunol. 2004;4:630–640. - PubMed
-
- Altfeld M, Allen T. Hitting HIV where it hurts: an alternative approach to HIV vaccine design. Trends Immunol. 2006;27:504–510. - PubMed
-
- Carlson J, Brumme Z. HIV evolution in response to HLA-restricted CTL selection pressures: a population-based perspective. Microbes Infect. 2008;10:455–461. - PubMed
Publication types
MeSH terms
Substances
Grants and funding
LinkOut - more resources
Full Text Sources
Other Literature Sources
Research Materials
